Election Year Stock Market Stats & Historical Performance
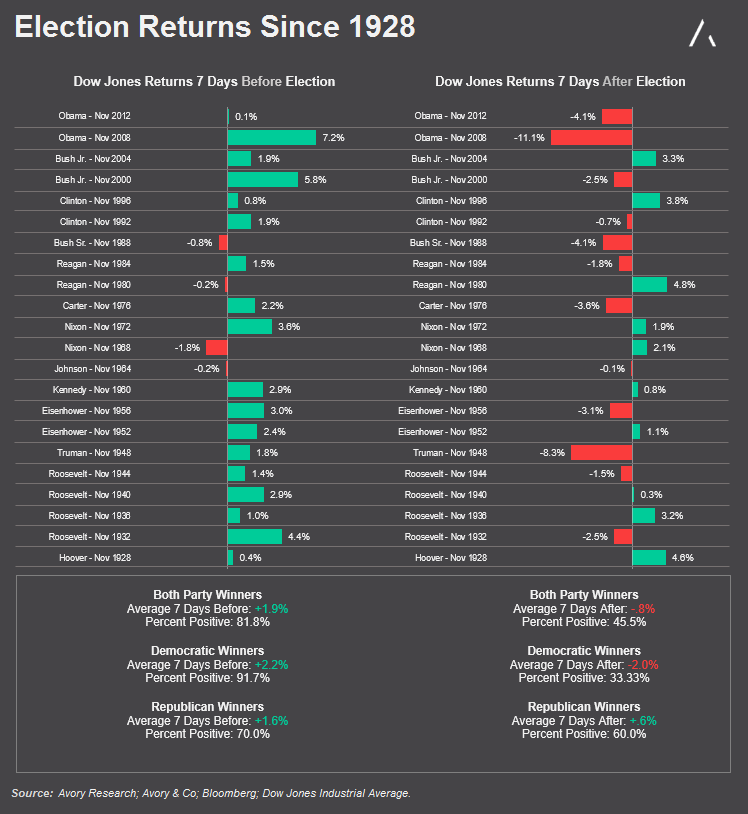
The elections are fast approaching with less than 10 trading days left. We looked back at all the elections since 1928 and discovered that the stock market has performed best during the 7 trading days leading up to the election. Note that we used the Dow Jones Industrial Average (INDEXDJX:.DJI) as our benchmark.
When?
On average the market has gained 1.9% during those 7 days, and positive 81.8% of the time.
Which Party?
When we broke out eventual republican versus democratic winners, the results highlighted how equity markets clearly performed best with democratic winners.
The Breakdown
On average the markets were up 91.7% of the time and averaged 2.2% during the 7 days leading up to a democratic winning election. However, the 7 days after the election are just the opposite. The 7 days post elections have proven to be the worst period to invest in. On average the market has gone down -.8%, with positive returns only 45.4% of the time. Markets with eventual republican winners have historically outperformed during the 7 trading days following the election. Not all elections are the same, but having data dating back 80+ years should provide you with another research input as you formulate an election trading strategy.
You can catch more of my market insights on my site, The Market Meter. Thanks for reading.
Twitter: @_SeanDavid
The author does not have a position in mentioned securities at the time of publication. Any opinions expressed herein are solely those of the author, and do not in any way represent the views or opinions of any other person or entity.


