Sometimes stepping back the day to day price movements can help us get a better perspective on the markets. When we look at a chart of the Dow Jones Industrial Average from 1920 to present, we can see each of the bull and bear market cycles. But we can also see some longer term support and resistance trend lines. And right now, the Dow Jones is bumping up against a long-term resistance line.
And this Dow Jones resistance level isn’t your ordinary price resistance…
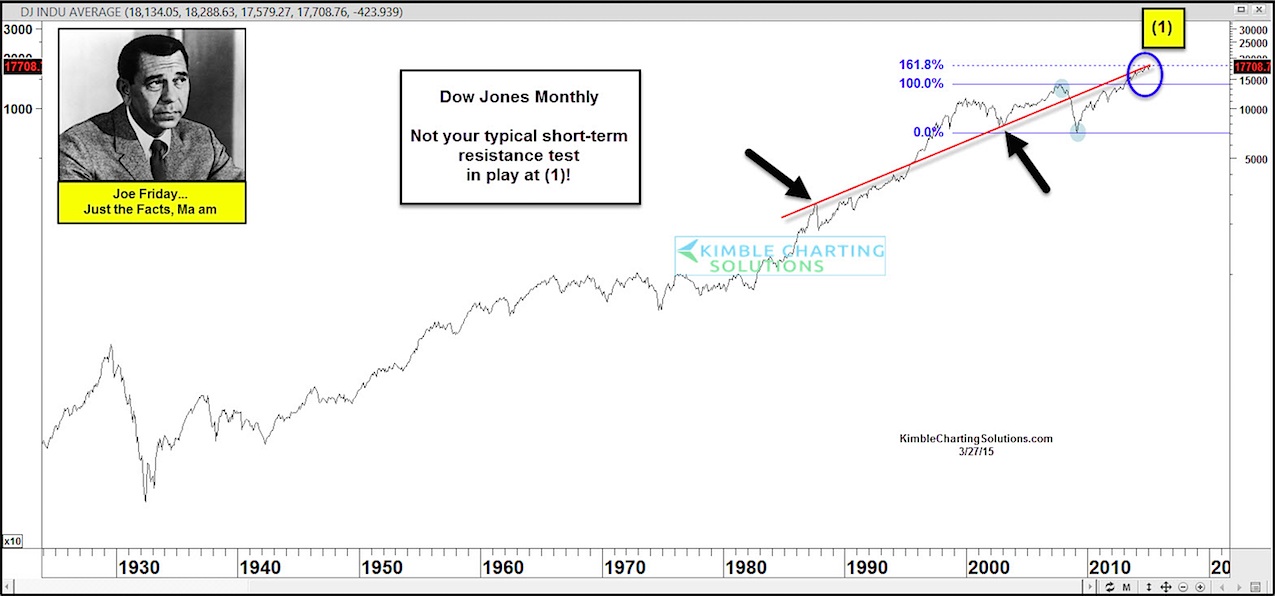
Taking a closer look at the chart below, you can see that this Dow Jones resistance level is drawn from the 1987 highs, through the 2002 lows, and extended to present. But there’s another layer. It also runs through a key Fibonacci extension level tied to the 2007 highs and 2009 lows on the Dow Jones Industrials.
We don’t see this combination very often! Keep in mind that with a longer term chart like this the outcome at (1) might be important 2 months from now and/or 2 years from now!
Dow Jones Industrial Average – Long-Term Price Resistance Level
Follow Chris on Twitter: @KimbleCharting
Author does not have a position in any mentioned securities at the time of publication. Any opinions expressed herein are solely those of the author, and do not in any way represent the views or opinions of any other person or entity.


 Ready To Break Out?")

