Crude Oil has been methodically working its way higher as risk-on has been en vogue.
But it’s nearing an important resistance level that many computer algorithms are aware of: the yearly price pivot.
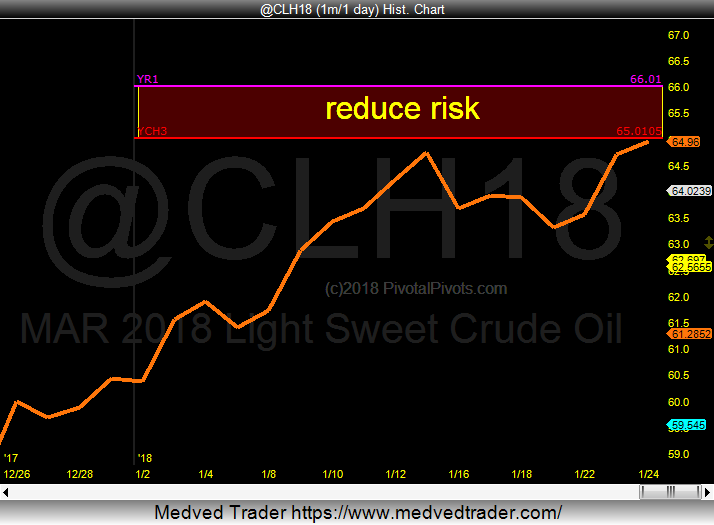
In 2017, crude oil prices found support and bounced off the yearly S1 pivot point (see chart 1 below). Fast forward to this year, and crude oil is testing resistance at its 2018 Yearly R1 pivot point (see chart 2 below).
In my opinion, this is a good spot for traders to reduce risk on crude oil and oil and energy related ETFs, $USO and $XLE. There’s a rising amount of bulls heading into this important price pivot, so this should bring a pause.
Chart 1: 2017 Crude Oil Trading Chart
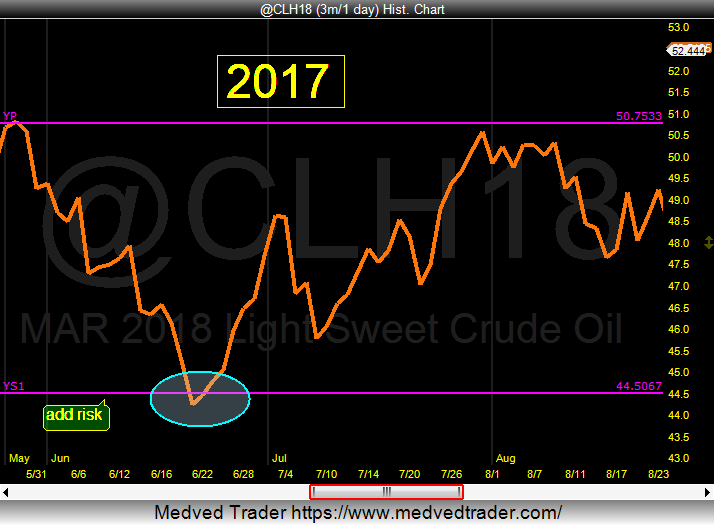
Chart 2: 2018 Crude Oil Trading Chart
Computer algorithms are programmed to buy & sell at pivot points. That’s why my charts only show pivot points. All I care about as a trader is where the algos will be buyers and sellers. I want to follow them!
Know In advance where these key Pivots are at on Pivotal Pivots or catch me on Twitter.
Twitter: @Pivotal_Pivots
The author may have a position in mentioned securities at the time of publication. Any opinions expressed herein are solely those of the author, and do not in any way represent the views or opinions of any other person or entity.


