In this article we take another look at a somewhat obscure indicator “implied correlations“.
The Implied Correlation Index comes from the CBOE and is a sister index to the much more popular VIX or implied volatility index (with cousins, VVIX – implied volatility of the VIX, and SKEW – tail risk indicator).
Each of these indicators have their own particular merits for use by market analysts looking at timing and tactical decision making, and I’ll talk about how to use the implied correlation index here. The chart appeared in the latest edition of the Weekly Macro Themes.
And here’s the chart: implied correlations have fallen to lows (note: the indicator is inverted!) last seen prior to the financial crisis…
CBOE Implied Correlation Index vs S&P 500 Index (INDEXSP:.INX)
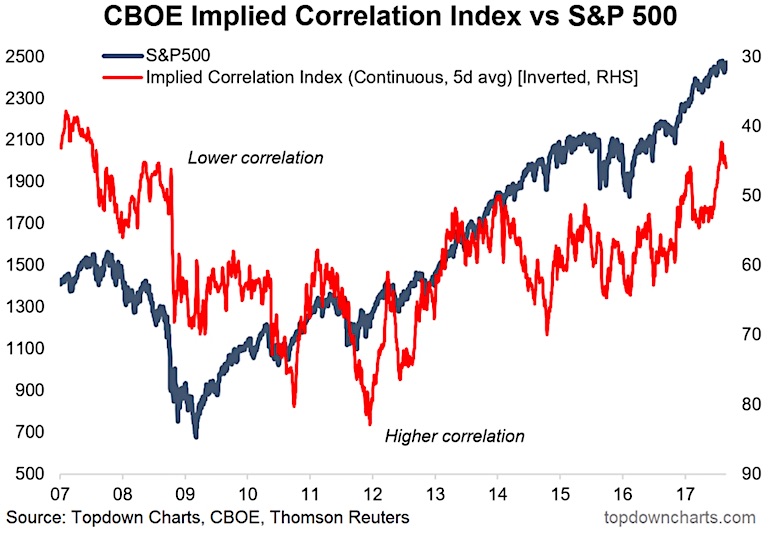
The main rule of thumb for the implied correlation index is that lower correlations tend to occur around market tops (major tops and short-term peaks), while higher correlations tend to occur around market bottoms.
Rather than seeing a pattern where there is none (something that we as humans are prone to do), there is some logic to it. During a crisis or market panic, correlations both within and accross asset classes often tend to converge towards 1. Why? It’s the old phrase “SELL EVERYTHING!”. When people de-risk their portfolios and ‘sell everything’ – sell indiscriminatly – it gives the assets a common driver and in the short term their price behavior looks pretty similar. This phenomenon is accentuated by the growing use of passive investment vehicles which by their nature ‘sell everything’ when investors put in redemption requests.
In many ways, implied correlations are effectively another, if less direct, way of measuring investor sentiment.
So with implied correlations recently drifting down towards pre-crisis levels, it’s fair to say that the signal at the moment is bearish from this indicator alone. Of course it pays to look at indicators not in a vacuum but as complementary and confirming pieces of information. Returning to the title though, the implications of (low) implied correlations is generally short-term bearish.
Twitter: @Callum_Thomas
Any opinions expressed herein are solely those of the author, and do not in any way represent the views or opinions of any other person or entity.
 Rolling Over At Key Fibonacci Level?")


