Market Breadth Alarm Bells?
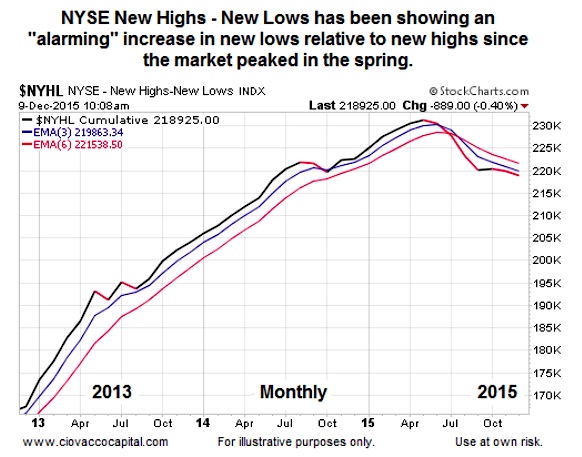
The chart below shows NYSE New Highs vs New Lows.
If you follow the markets, you probably know recent stats in this area have been slanted toward the new low side of the equation. When this happens it hints that market breadth may not as healthy as stock market bulls would like.
But as with any stock market indicator, it requires more research and analysis before taking any actions.
NYSE New Highs vs New Lows Chart – 2015
Is This “Take Action Now” Information?
Obviously, all things being equal stock market bulls would prefer to see new highs expanding relative to new lows. Therefore, the 2015 breadth chart above is relevant. However, it is logical to ask the following questions:
- How relevant is the recent weakness in the measure of market breadth from a historical perspective?
- Does it mean a bear market is just around the corner for stocks?
- Is cash the place to be?
- Is it prudent to short stocks based on the weakness in this market breadth indicator?
- Should we run to Costco and stock up on canned goods?
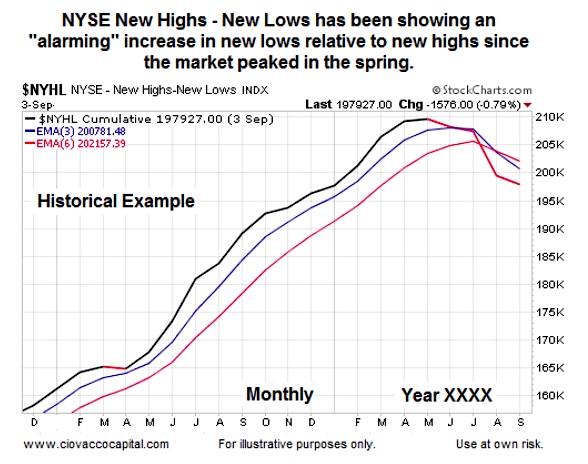
Walking Through A Real World Historical Example
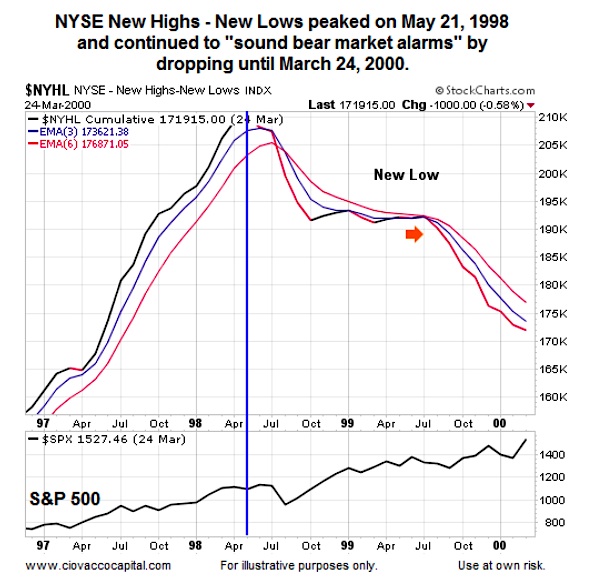
The chart below is the same NYSE New Highs – New Lows indication on the same timeframe as the 2015 chart shown at the top of this article. The years have been removed from the chart below. Notice how the 2015 chart and the chart below look similar. Let’s assume we decided to “cash out” of the stock market when the New Highs vs New Lows indicator below peaked; we can also assume that some of us decided to short stocks since “market breadth is sounding bear market alarm bells”.
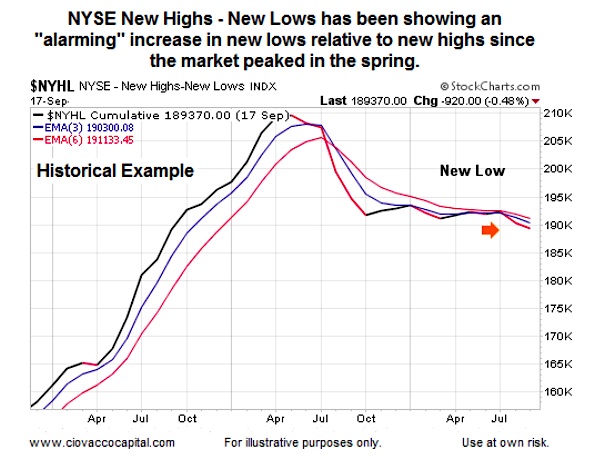
Fast Forward One Year
Well, it looks like cash and shorts have been having a good time over the past year. Market breadth has not improved; in fact, New Highs vs New Lows just made a new low.
Thankfully, We Got Out Almost Two Years Ago
Market breadth has saved our bacon. Given NYSE New Highs – New Lows have been waving bear market flags for almost two years now, we must be pulling up to our new house in our brand new car, given all the money we have saved or made being short for the last two years.
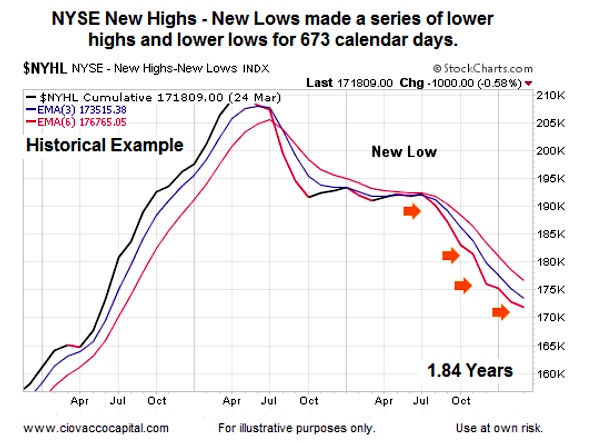
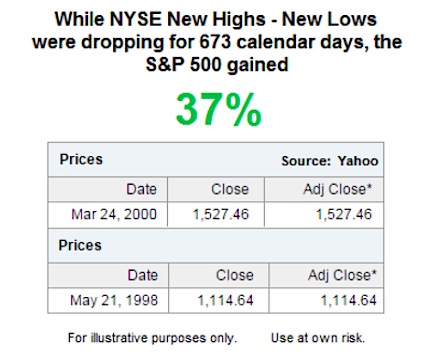
So How Did Stocks Do Over The Same Two Years?
The answer to the question above is quite well. The S&P 500 gained 37% as NYSE New Highs vs New Lows continued to show weakness.
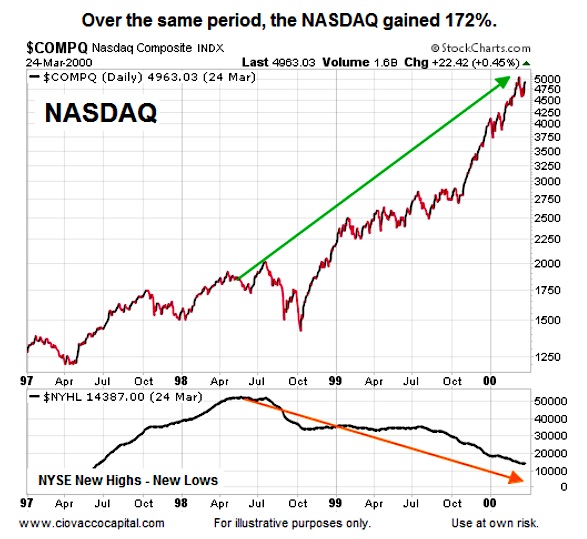
How About The NASDAQ Over The Same Period?
Hopefully, those in our hypothetical example who shorted based on weakening NYSE New Highs vs New Lows almost two years ago, decided to short the S&P 500, rather than the NASDAQ. The NASDAQ gained 172% while breadth was “bearish”.
But, Your Example Is During A Rare Bubble
Yes, that is true and a fair rebuttal. However, regardless if it occurred during the dot-com boom, Camelot, or the Tulip Bulb Mania, any market breadth indicator that could be “wrong” for almost two years, or an indicator that might have told us to short the S&P 500 while it gains 37%, is not a timing tool we want in our risk-management arsenal. Are there things to worry about in 2015 from a bearish perspective? Yes, but expanding new lows relative to new highs is not anywhere close to the top of the list.
But, In Your Example Most Stocks Still Went Down, Right?
Some may make the argument that the last two years of the dot-com bubble featured gains in a small number of stocks and that NYSE New Highs vs New Lows was still helpful. Over the same period, the Dow gained 22% and the Vanguard Total Stock Market Index Fund (VTSMX) gained 43%.
Thanks for reading.
Twitter: @CiovaccoCapital
Author or his funds have long positions in related securities. Any opinions expressed herein are solely those of the author, and do not in any way represent the views or opinions of any other person or entity.


