 All time highs are bullish almost all the time; and with 41 of them in the 221 trading days year-to-date (18.6% of the time), 2014 has had a lot of them. In fact, though it might not feel like it amidst a considerably choppier year than 2013, 2014 is tracking to tie or just exceed the 45 all-time highs installed then (h/t to my buddy Ryan Detrick). According to Sam Stoval of S&P Capital IQ, secular bull markets spends 9% of all days at all time highs, whereas 2013 and 2014 have registered over twice that.
Strength and momentum tend to beget more of the same.
But looking at these stats in isolation is little more than trivia. After all, though it’s a small subset of the total, all bear markets begin the day after a day on which equities hit new all-time highs. Probability tells us to minimize this outcome in our market outlook; but also places the onus on us to look beyond stats a well-lit vacuum to the dark waters of the market context we’re treading into.
Despite November’s almost catatonic performance month-to-date (if accompanied by toppish call buying), the S&P 500‘s (SPX) 22-Day Rate of Change (measuring from the 10/15 lows) is still greater than any such period since October 2011, and August 2010 before that. Those readings were prompted by +11.5% and +16.5% rallies, after which -8% and -10.5% declines immediately followed, each pulling back to the 61.8% retracement of the preceding rally before putting in a floor.
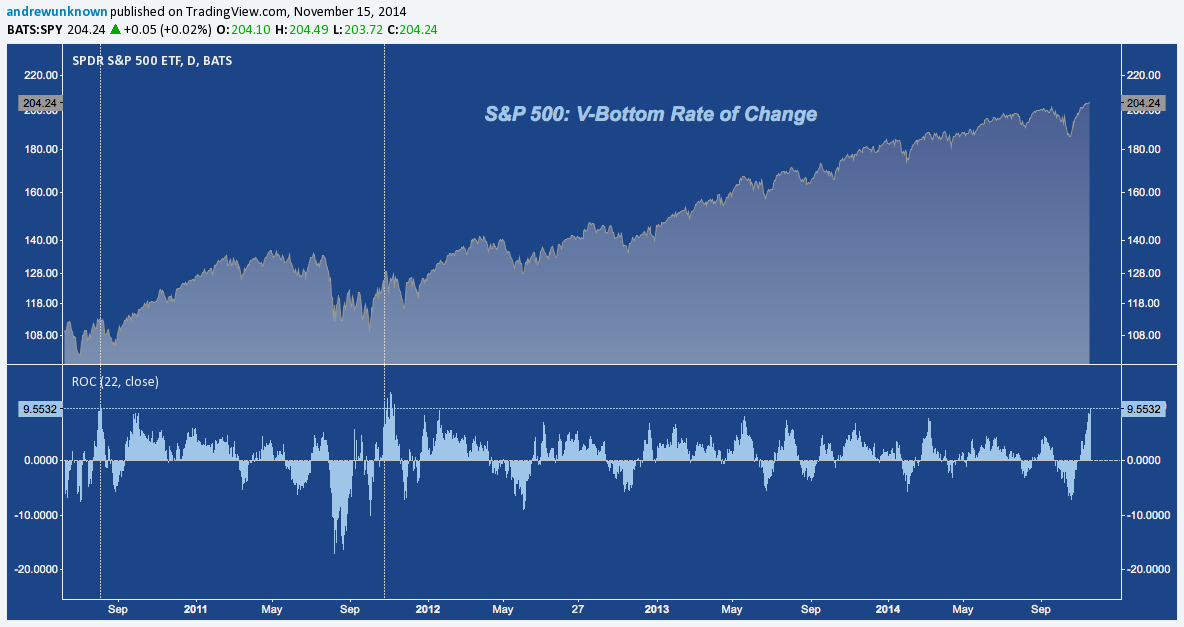
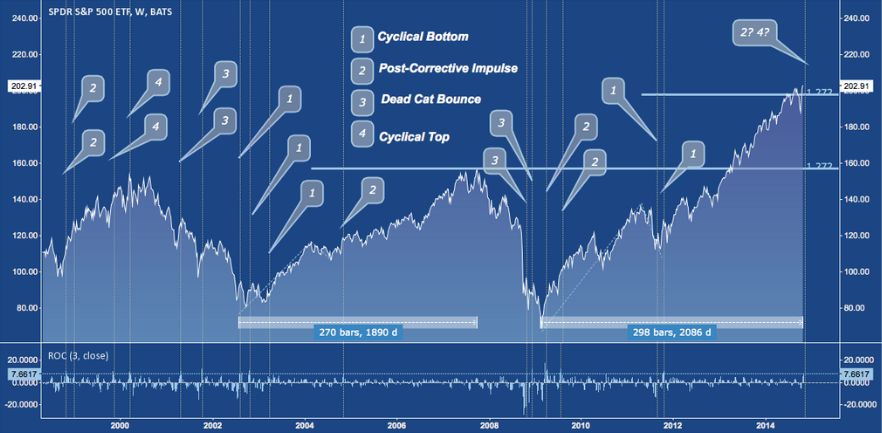
Just like those moments in Summer 2010 and Fall 2011, the S&P has just produced a powerful post-corrective impulse move higher. Both of these rebounds occurred as bulls and bears skirmished violently for control, ultimately hammering out a sustainable bottom through the fits and starts of range expansion on high volume.
Yet the placement, duration and character of these drops contrasts notably with September-October’s decline. Instead, historic V-Bottom rallies in mature bull markets (4th longest of the last 100 years at 69 months with 1987-2000, 1921-1929, 1949-1956 longer) with redlined hard (NYSE Margin Debt, ISEE, Rydex Bull/Bear, etc.) and soft sentiment measures, staged at all-time highs that attain at least nominal higher highs provide a more credible basis of comparison.
2007’s analog provides the best recent example:
The chart below compares the period of mid-October 2002 – mid-October 2007 (60 months) with January 2010 – mid-November 2014 (58.5 months), culminating with the Correction + V-Bottom in July-October 2007 that was coincident with the cyclical top then.
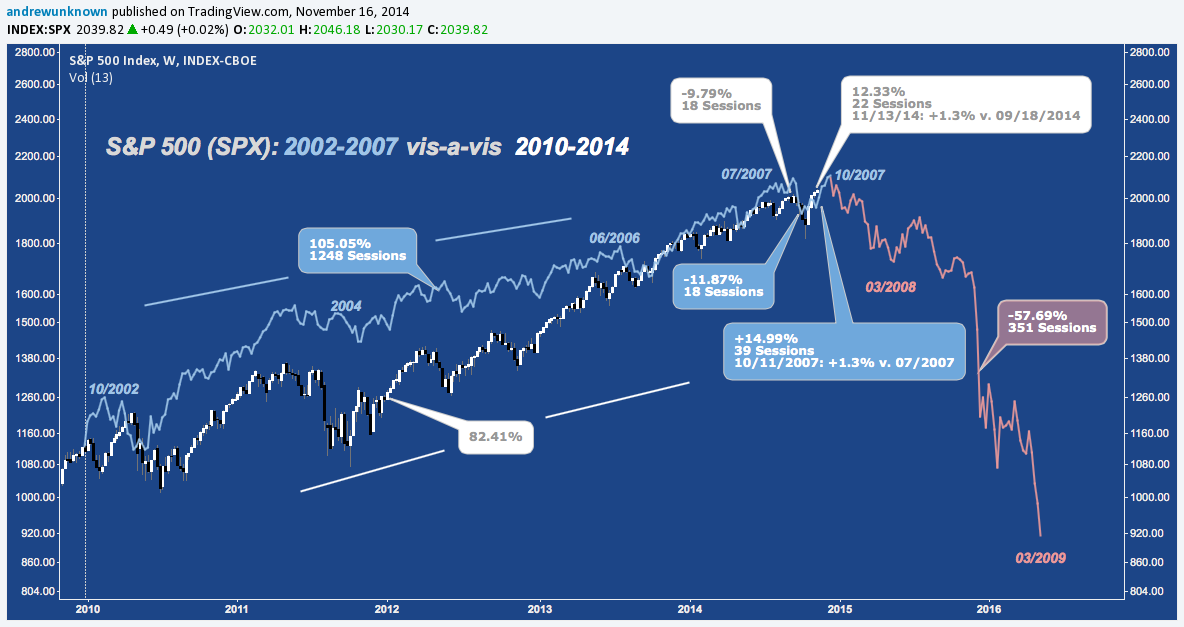
What emerges is a progression remarkably similar to the current market (both time series are log scale with neither axis adjusted to optimize fit):
- Resurgence from an early dip (March 2003/Mid-2010) that
- Lapses into a choppy middle act (2004-2005/2011-2012) from which
- The trend quickens pace into a seemingly indomitable rising channel higher (Spring 2006-Fall 2007/Spring 2013-Sep 2014) that
- Suffers a jolting interruption with an uncharacteristically deep sell off that is answered by an even more impressive reflex rally (Now)
2007’s V-Bottom sequence was even more dramatic than 2014’s. In July of that year, SPX lost -11.87% in 18 sessions. The V-Bottom rally that followed added +14,99% over the next 39 sessions, capping out on 10/11/2007 at 1576.09 with a net +1.3% gain versus July’s all-time high at 1555.90 (which just exceeded March 2000’s 1552.87 peak). The entire sequence unfolded of 58 sessions, or just shy of 3 months.
2014’s V-Bottom the S&P gave up -9.79%, also in 18 sessions. The V-Bottom rally underway has tacked on +12.33% over 22 sessions, peaking on Thursday at 2046.19 for a net +1.3% gain versus September’s all-time high of 2019.26. 40 sessions have elapsed in this sequence to-date.
Do (carefully and honestly constructed) analogs have predictive value? Perhaps. Today’s current macro environment is superficially dissimilar to 2007; but many structural themes – from debt to speculative appetite – are shared, and potentially destabilizing geopolitical risks seem far greater. Potential catalysts are many.
The point of this comparison is far less ambitious, though. 2002-2007 – and July-October 2007, in particular – serve as a cautionary object lesson for today. A massive V-Bottom sequence in the context of a very lengthy bull market – even one that makes new all-time highs – is not an unmitigated affirmation of the trend preceding it. On the contrary, the abrupt uptick in volatility after such an uneventful and seemingly inevitable is often a warning sign.
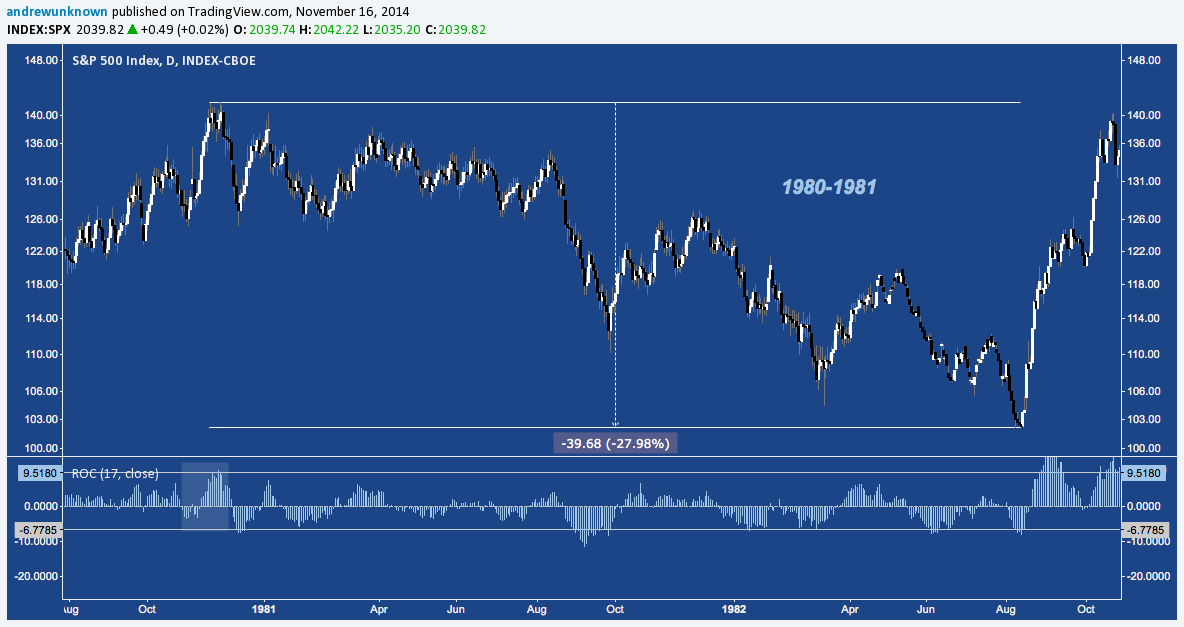
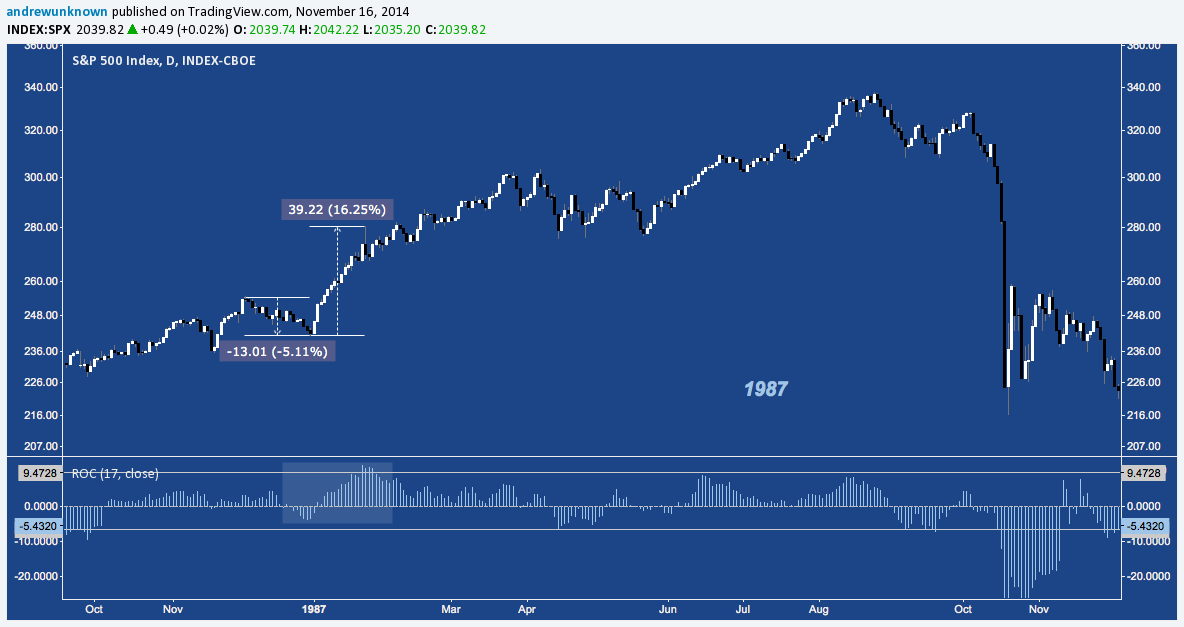
In fact, 2014’s V-Bottom is in rare company (that doesn’t include 2007). Only 4 previous occasions in the last 40 years have seen a smaller sell off from all-time highs before producing a greater rally according to the 17-Day Rate-of-Change (RoC) that expresses the rally from 10/15-11/10 (after which SPX is effectively unchanged). Those occurrences are highlighted below:
1980-1981‘s occurred just prior to the bear market and accompanying recession of 1981-1982, just over 3 years after early 1978’s bear market bottom. You can see the RoC in the bottom panel, with 10/15 and 11/10’s levels denoted by the horizontal lines:
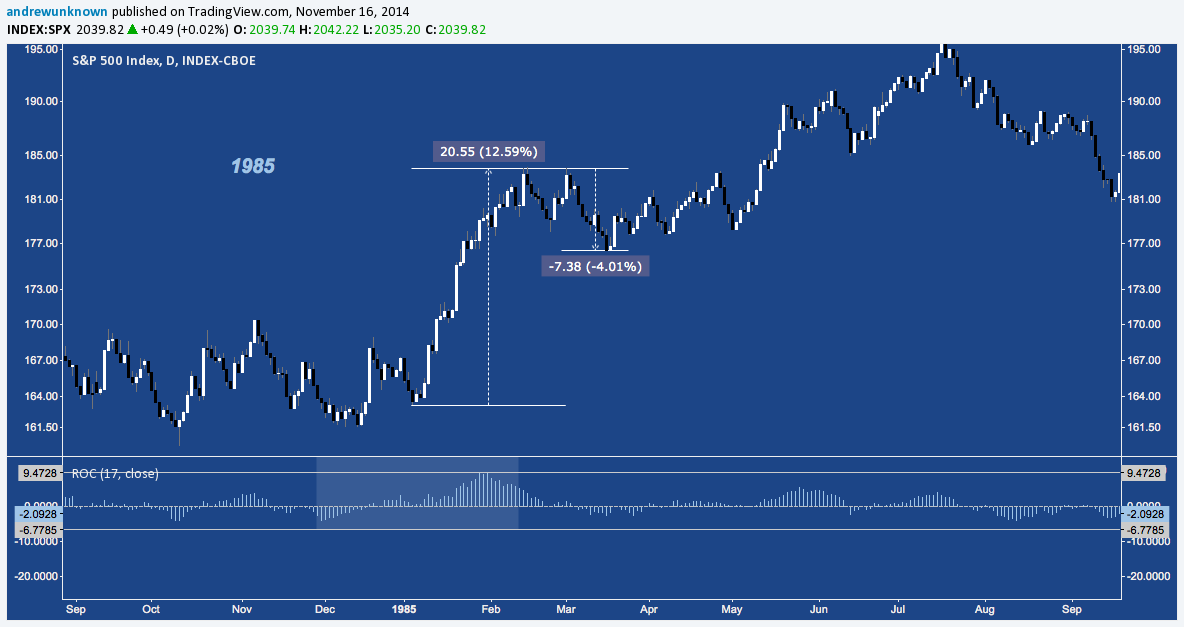
1985‘s occurred in wave 3 of the August 1982-October 1987 Bull, 2.5 years after the previous market bottom. The pullback following the rally was modest and short-lived before the trend resumed higher.
 1986-1987‘s is the most impressive: a -5% pullback before 1987 opened up with an explosive double-digit rally that kicked off Wave 5, 53 months into the 62 total that comprised the 1982-1987 bull run. The ultimate resolution of this fit of irrational exuberance can be seen on the far right:
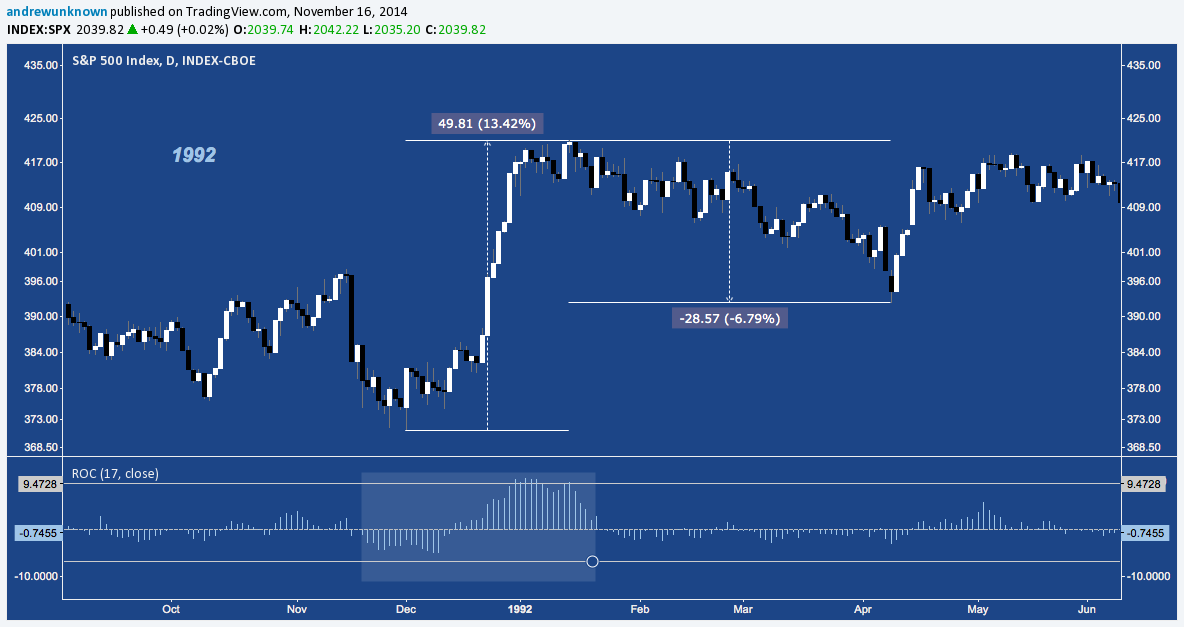
1992 began flat versus July 1990’s 369.78 all-time high, with a -20.4% bear market, recession and the S&L Crisis between. This 13.4% rally to new-all highs 15 months after the October 1990 bottom was really the first leg higher of the greatest bull market in history: 1990-2000. 1992’s spike higher gave back half its gains before turning and moving steadily higher over the coming months.
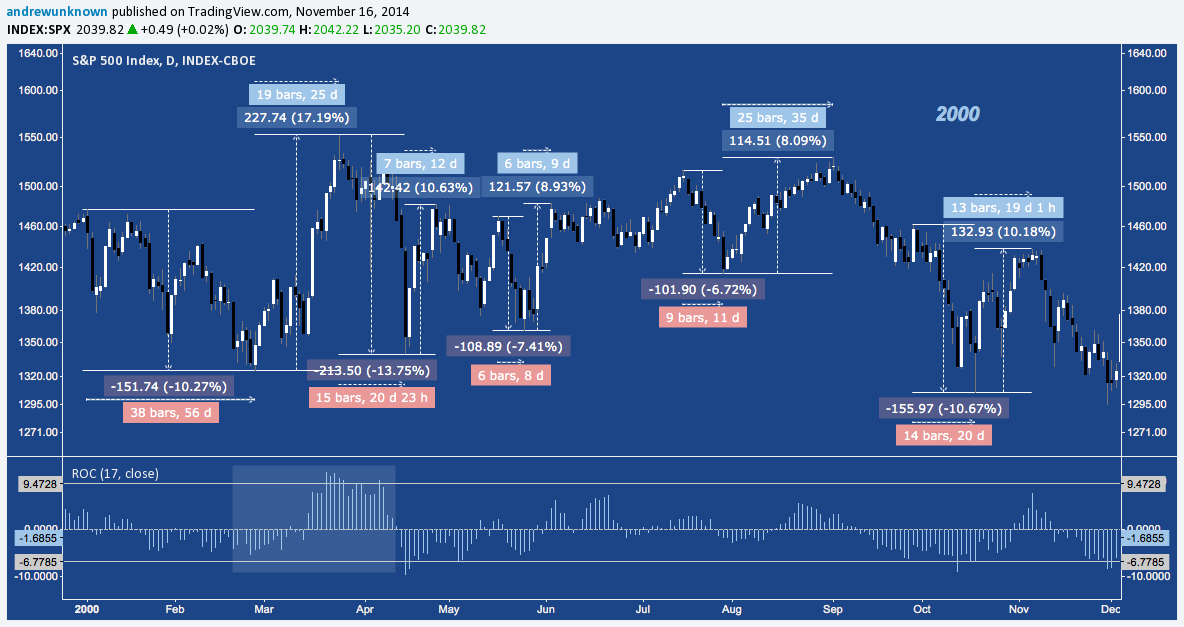
2000‘s was the last such rally prior to 2014’s, occurring at the other of that record 117-month run without a -20% correction in February-March. Like 1980-1981’s, this one perfectly top-ticked the bull market that had preceded it. 2000 was an entire year of V-Bottom rallies. None matched February-March’s range or managed to push over March’s high, but they do stand together as a reminder that abrupt whipsaws in momentum and volatility are symptomatic of a cyclical shift into a more adverse environment:
Among these results, you might’ve picked up that 2014’s reading occurs furthest into a cyclical bull market at 68 months second only to 2000’s reading (to which it doesn’t even come close). Other, shorter-term studies also attest to this V-Bottom’s distinctive character. Given it’s placement and some historical precedent, it’s worth asking: is it also creating a cyclical top as it did in 1981, 2000 and 2007?
Around the time I published this chart (11/06), my friend Dave Budge began running a poll structured around George Soros’s Theory of Reflexivity that dovetails with it well. Cleverly, the poll seeks to gauge market sentiment by asking respondents to assess where the current market cycle is in terms of collective market sentiment (got that?). The study is new and the sample to-date is tentative, but in the early going results have clustered around three responses on a scale of 1-7:
Early-Cycle: “2 – The period of acceleration, when the trend is recognized and reinforced by prevailing bias”
Early/Mid-cycle: “3 – The period of testing. Prices suffer a setback. If the bias and trend hold, prices extend more and become more exaggerated.”
Late-cycle: “5 – The twilight period. People continue to play the game, but they no longer believe in it.”
According to Soros’s theory, the poll is working perfectly (cast your vote and check out results here). Answers will vary markedly depending on the time horizon the respondent has in mind; but assuming 2009-2014’s cyclical bull is the most common point-of-reference, votes for 2-3 are affirmed by the skepticism of those voting 5, and those voting 5 receive their own contrarian vindication from all “early cycle” votes.
For my part, the view from atop the most exaggerated V-Bottom in 14 years and 4th longest bull of the last century suggests the 5s might have it.
Trade ‘Em Well.
Twitter: @andrewunknown
Kassen holds no exposure to securities/instruments mentioned at the time of publication. Commentary provided above is for educational purposes only and in no way constitutes trading or investment advice.

: Showing Some Signs of Emerging Strength")
