First off, let me start by saying that no one can predict major market tops and bottoms. All we can do as participants is to put together the pieces of puzzle to get a clearer picture of what’s happening and whether there are any warning signs.
With this in mind, I thought I’d try to collect some of the puzzle pieces and lay them out in a post.
In my opinion, the best way to visually see those pieces is through charts. Below are some of the more interesting charts that I’m seeing in the markets right now. And they amount to 5 warning signs that I think investors should be tracking.
1. The Russell 2000 – S&P 500 Potential Topping Pattern
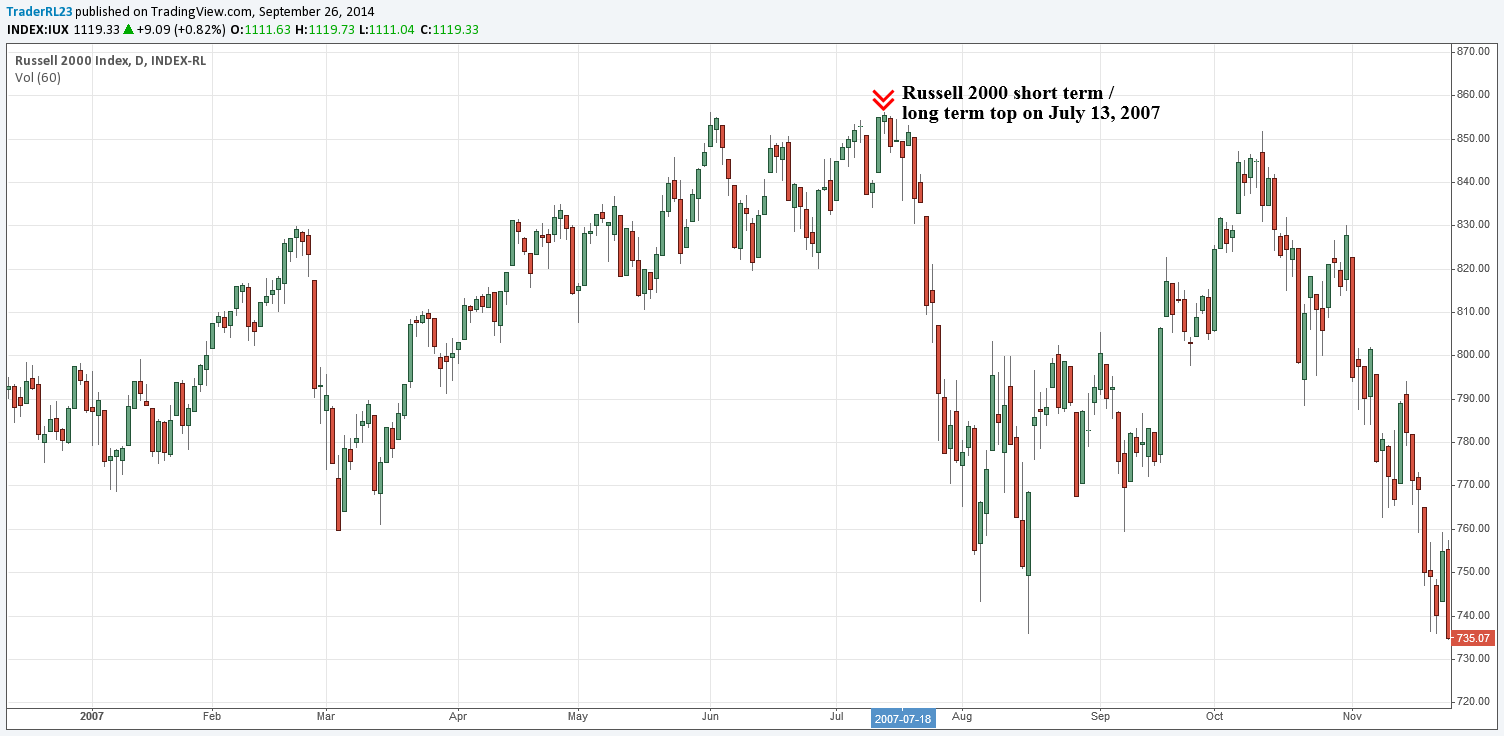
The first group of charts looks at the Russell 2000 and the S&P 500. The Russell is an important index to watch because it tends to lead you out of bear markets and bull markets. Understanding this, let’s take a look at the Russell 2000 and S&P charts from the 2007 market top and try to identify some warning signs.
The first chart shows that the Russell 2000 topped out on July 13, 2007.
The next chart is of the S&P 500. Take note where the Russell 2000 topped out, in relation to the S&P 500. Also note how the S&P 500 went on to make new all-time highs a few months later, while not getting confirmation from the Russell.
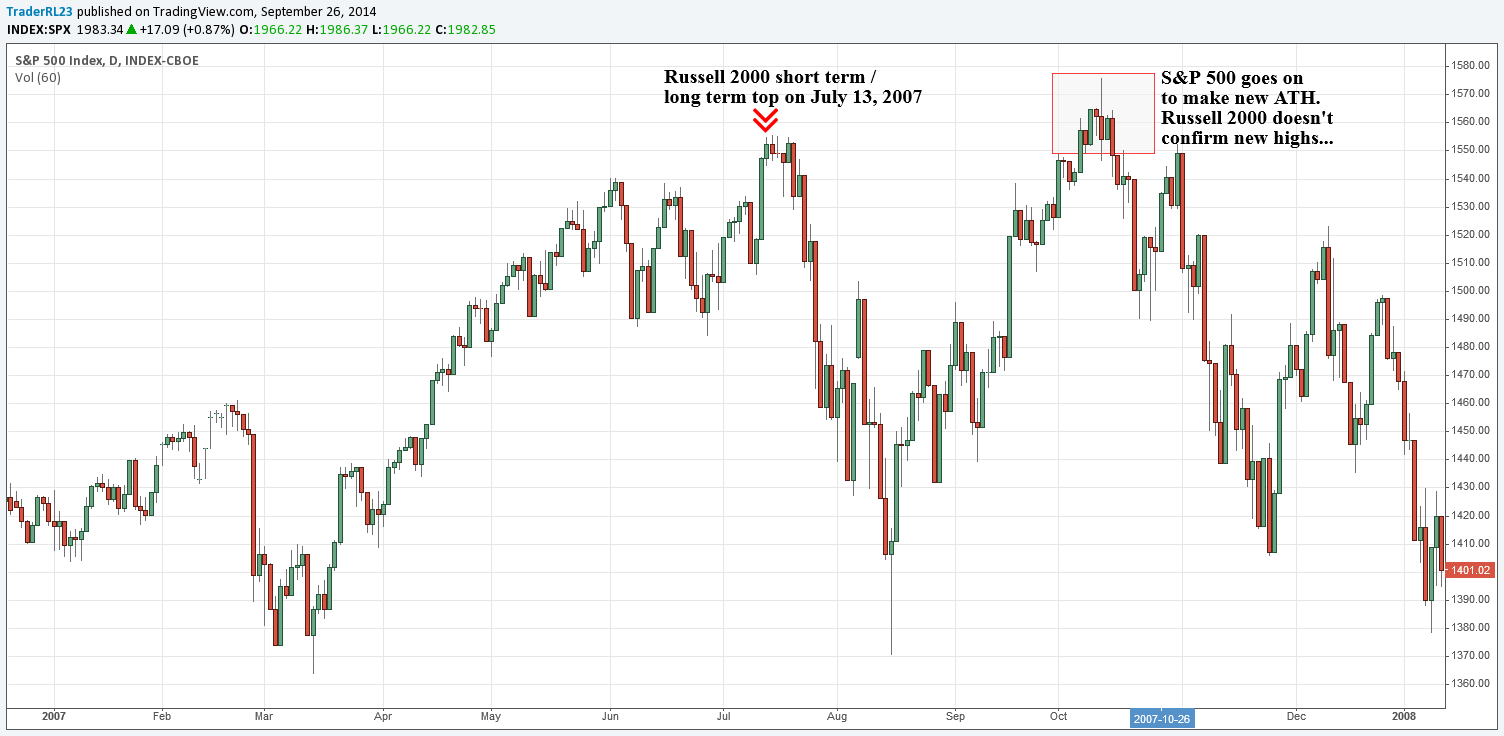
All of this looks awfully similar to what we are seeing in 2014.
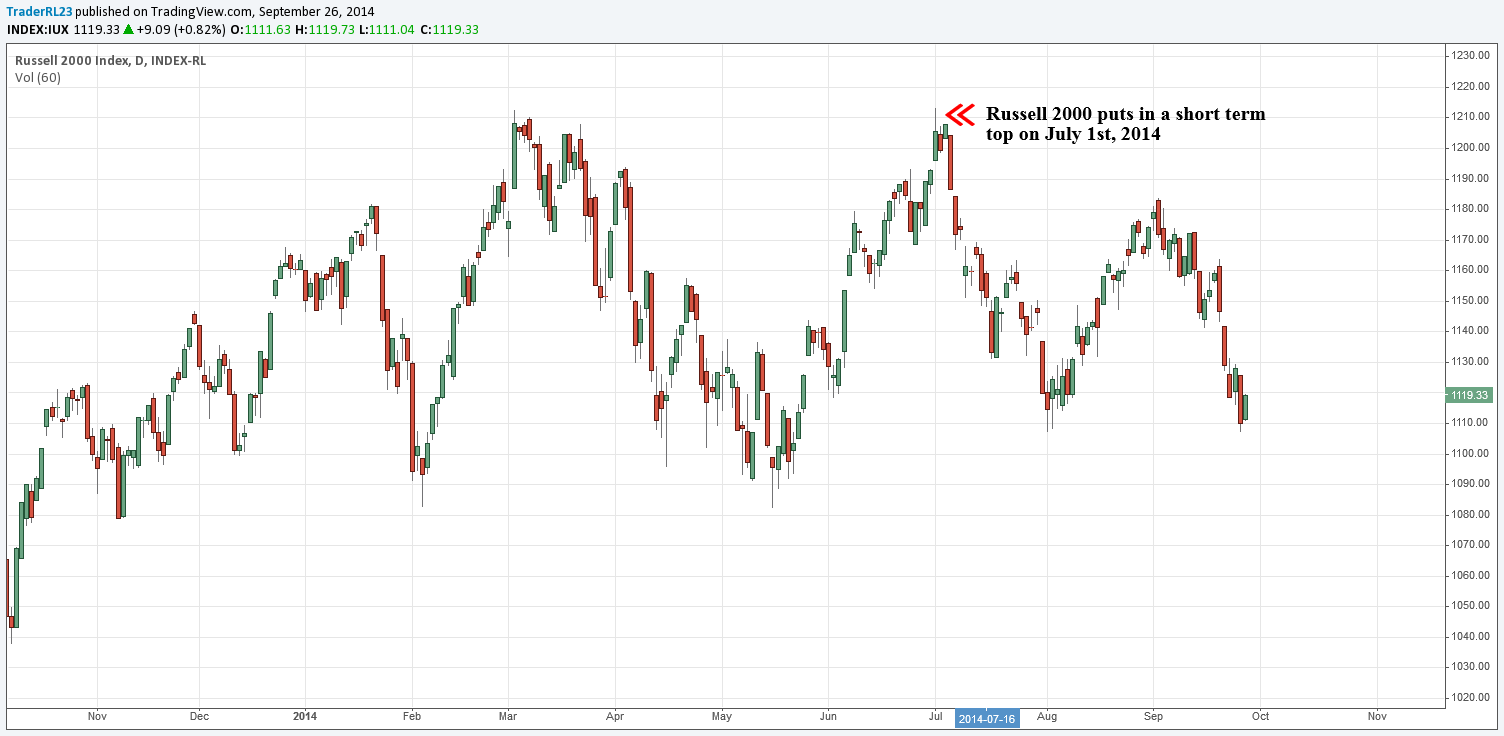
Here is a chart of the Russell 2000. It simply shows that we’ve been range bound for the whole year and made a short-term top on July 1, 2014.
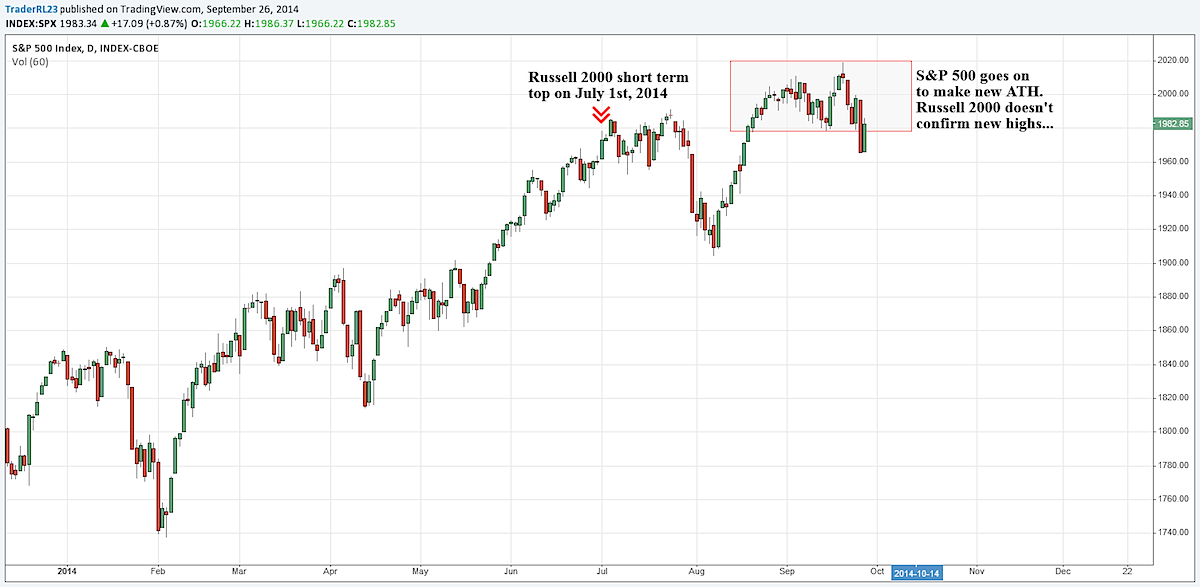
The next chart is a chart of the S&P 500. Take note where the Russell 2000 topped out, in relation to the S&P 500. Also note how the S&P 500 went on to make new all-time highs a few months later, while the Russell didn’t confirm the all-time highs.
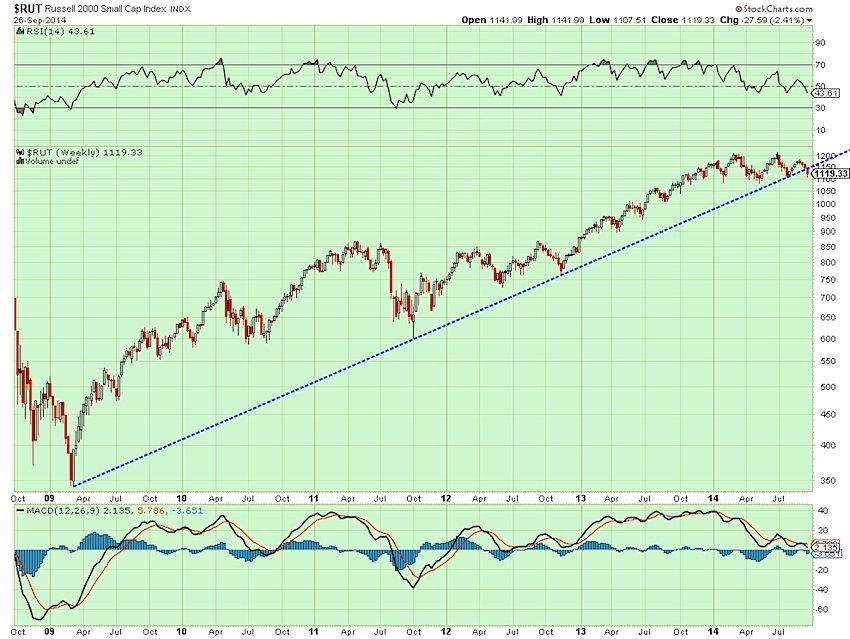
2. Russell 2000 Long-Term Trend Line Break
The chart below is a long-term chart of the Russell 2000. As you can see, the Russell broke its long-term trend line this week. This is one of the more significant warning signs because that trend line goes all the way back to the 2009 bottom.
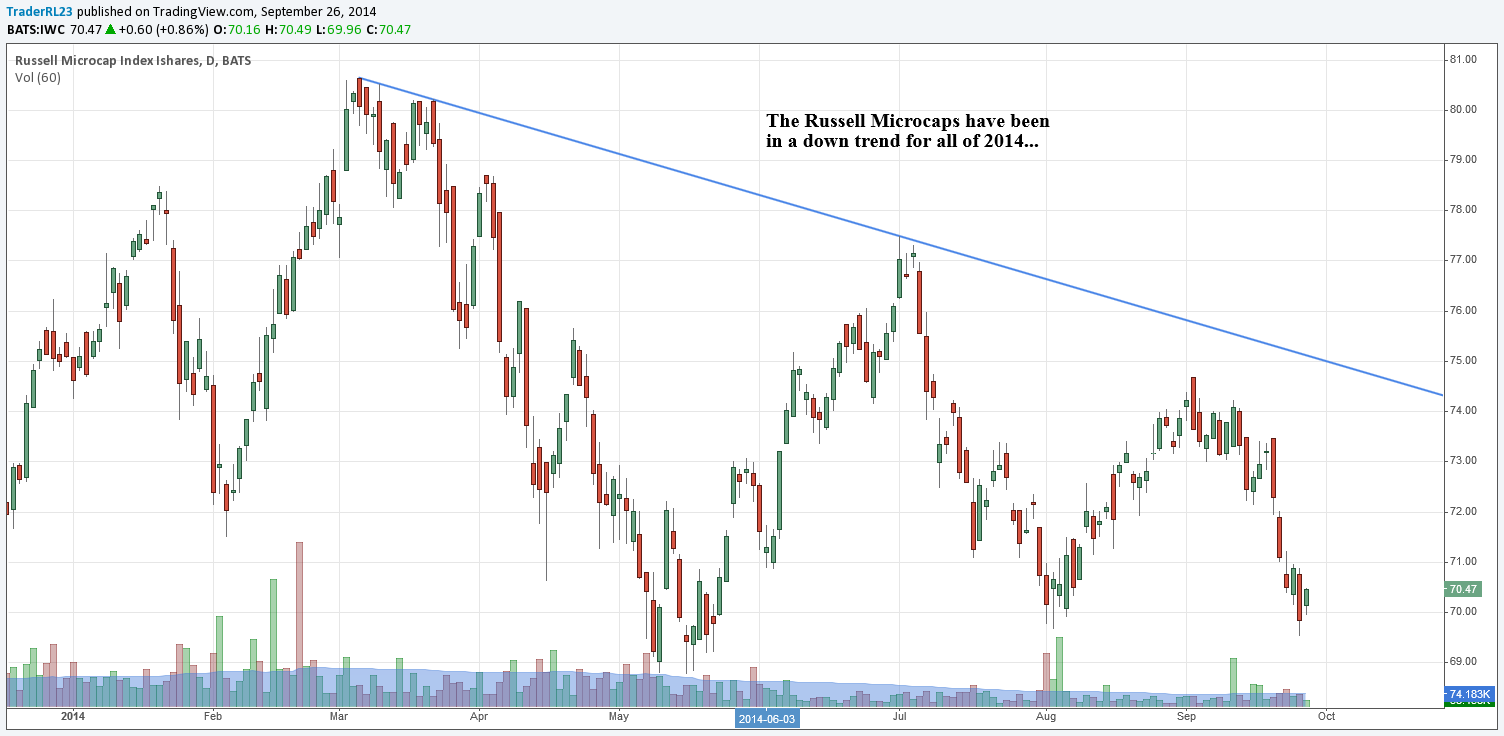
3. Microcap Stocks 2014 Downtrend
Next is a chart of the Russell Microcaps ETF (IWC). It shows that the microcaps have been in a downtrend for all of 2014. Risk appetite is definitely shifting away from micro caps.
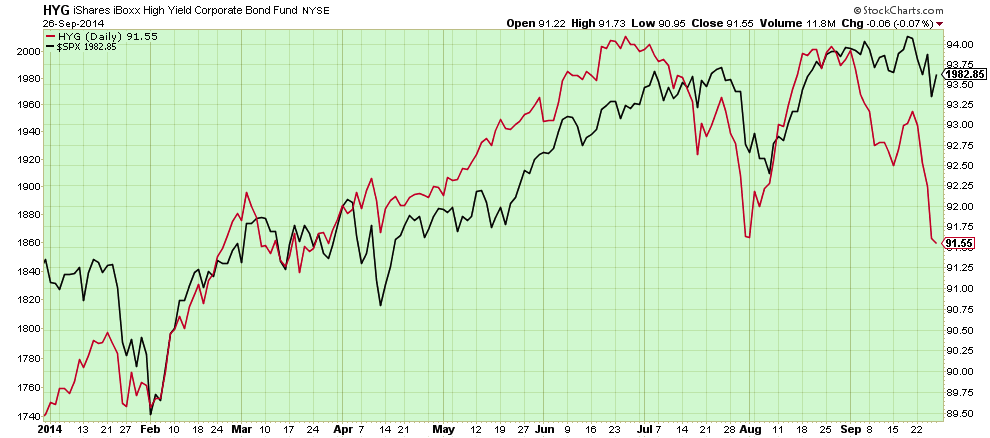
4. High Yield Bond Underperformance
The next warning sign in the markets shows up in a chart of the High Yield Bond ETF (HYG) vs. the S&P 500 (SPX). It shows that HYG has begun to underperform the S&P 500 in recent weeks. Will equities follow the HYG lower? Only time will tell.
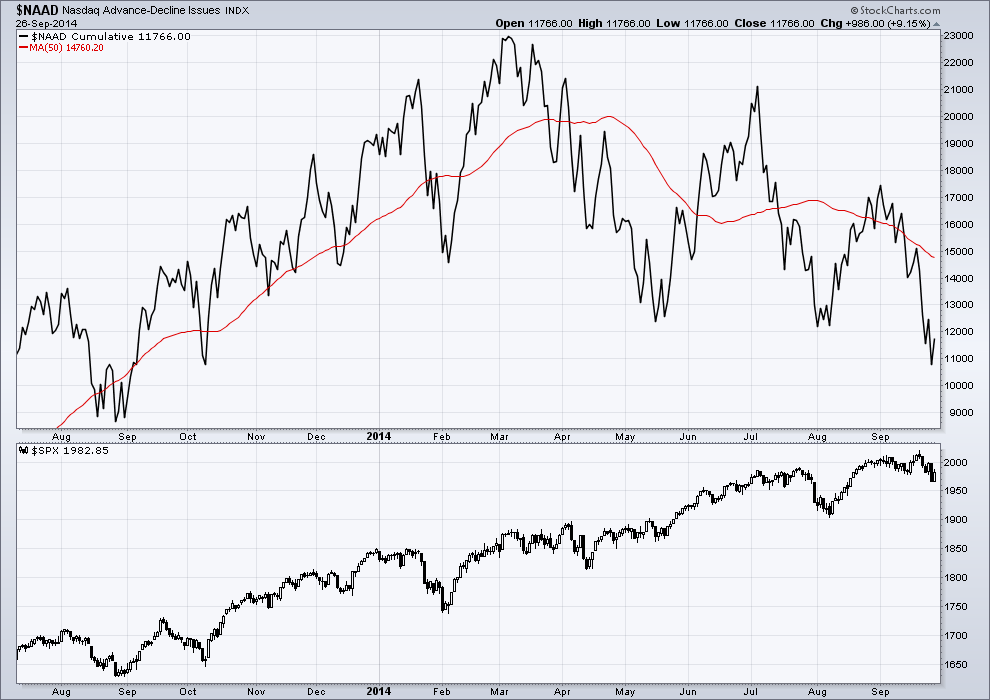
5. NASDAQ and Tech Stocks Deterioration
And finally, the chart below looks at the NASDAQ advance-decline issues. It clearly shows lower highs and lower lows in recent months. This is signaling deterioration under the hood for the NASDAQ.
Now, do all of these warning signs mean that we are on the verge of a bear market? No. But they do offer some pieces to the market puzzle that help investors understand where the markets are at and where they could be headed. Good luck and stay focused. Thanks for reading.
Follow Robert on Twitter: @TraderRL23
No position in any of the mentioned securities at the time of publication. Any opinions expressed herein are solely those of the author, and do not in any way represent the views or opinions of any other person or entity.


