It’s been a rough run for Zillow Group (ZG)… not only has the business struggled of late but it’s now seen it’s struggles hit the mainstream news.
For lack of a better phase, Zillow has become a punching bag on social media. It’s home flipping business is taking huge losses and, well, things just aren’t good.
As you can imagine, this has infiltrated its stock price. And as per usual, the stock price picks up on it well in advance…
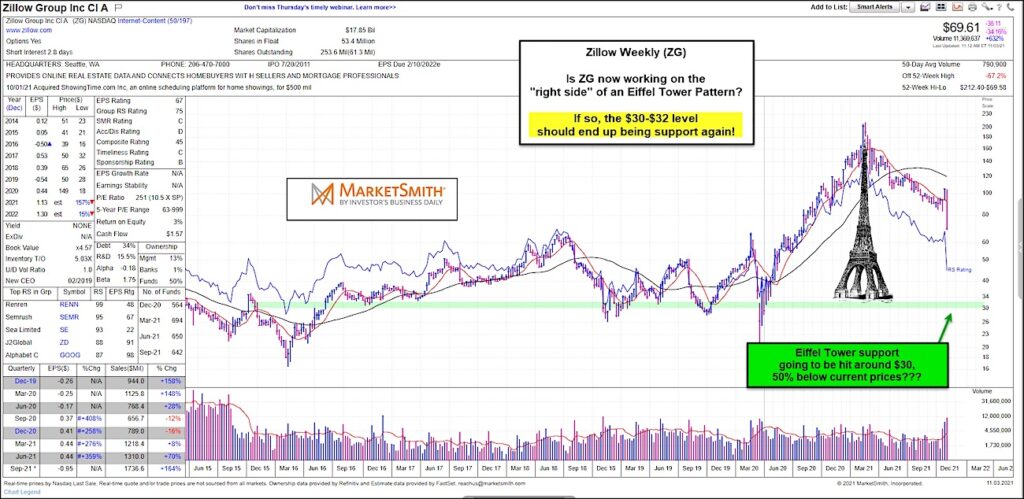
Here we look at a “weekly” chart of Zillow Group and an ominous pattern that took root several weeks ago. Here we have a potential “Eiffel Tower” pattern in the making with the right shoulder taking root in decline.
So how much lower could Zillow stock price fall? Well, if the pattern holds true to form, the stock could fall to $30-$32.
Yes, the stock has already stumbled big time… but could it fall another 50%? Stay tuned!
$ZG – Zillow Group “weekly” Stock Chart
Note that KimbleCharting is offering a 2 week Free trial to See It Market readers. Just send me an email to services@kimblechartingsolutions.com for details to get set up.
Twitter: @KimbleCharting
Any opinions expressed herein are solely those of the author, and do not in any way represent the views or opinions of any other person or entity.


