Every week there are plenty of interesting and eye-catching stock market charts, indicators and statistics that we could spend our time mulling over in private or talking about with friends and colleagues.
Some of these are noise, some are worthy of further consideration. In the former camp, I would place the spike in the percentage of stocks trading above their 200-day averages. For the S&P 500 its currently 90%+, the highest since 2013. A study from Ned Davis Research shows that is more noise than news, with market performance in the wake of such readings being sub-par in the near-term and not much different from median market returns six or twelve months later (this is in significant contrast to when more than 90% of stocks are trading above their 50-day averages, which is a “strength begets strength” type of breadth thrust).
The chart that caught my eye last week (I labelled it “One for the Weekend”) was the Value Line Geometric Index, which is challenging the down-trend off of its mid-2018 peak and is just below its early 2020 peak. Momentum, which tends to lead price, has already broken out to the upside. Improvement in the Geometric Index (which captures the performance of the median stock) is evidence of broad rally participation.
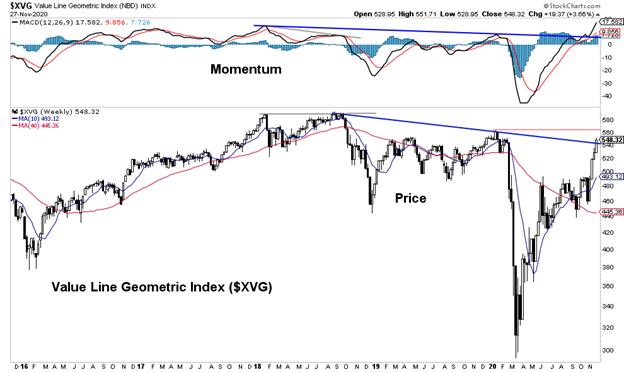
The median stock in the US is moving higher and the average stock (measured by the Value Line Arithmetic Index) is already at new highs. Add to this the improvement seen overseas, with both the MSCI Emerging Markets Index and the MSCI EAFE breaking out to new highs for 2020 and approaching their 2018 cyclical peaks. Strength in Copper (which is at its highest level in seven years) suggests Emerging Markets might have further room to run.
Taken all together and it is not surprising to see the Global Dow breaking above its early 2018 peak (h/t JC Parets of All Star Charts), suggesting an end to a nearly 3-year-old bear market in global equities. Investors need to resist the urge to be distracted by noisy questions of “why” and stay focused on the “what.” The “what” in this case is that the most bullish things stocks can do is go up and new highs are more bullish than not making new highs. Just speculating, but the last three years may be treated by history as an intense, time-shortened secular bear market (not just a series of cyclical pullbacks).
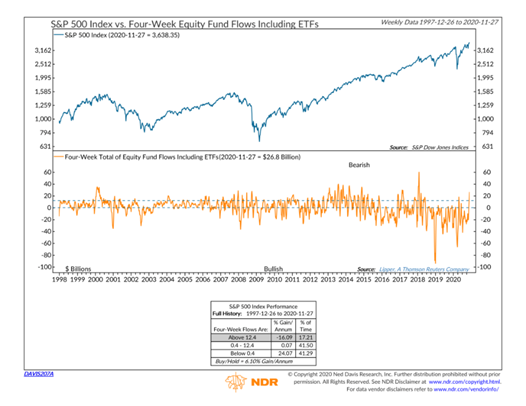
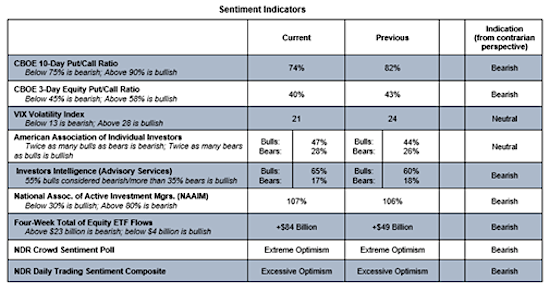
While the longer-term picture is improving, there is an argument for near-term caution. The bullish breadth backdrop is offset in an increasingly stark way by rampant and widespread optimism. We discussed it last week and it is even more prevalent this week. Just one example: equity ETF’s have seen more than $80 billion in inflows over the past four weeks. ETFs plus mutual funds have seen nearly $27 billion in inflows over the past four weeks. Over past 20+ years a surge in inflows has been consistent with pullbacks, not rally continuation.
Industry group rankings show continued strength overall and a rotation out of large-cap groups and into small-cap groups.
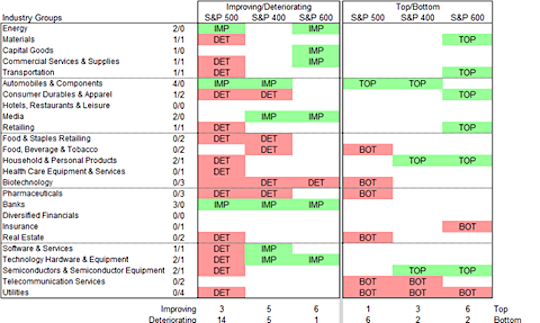
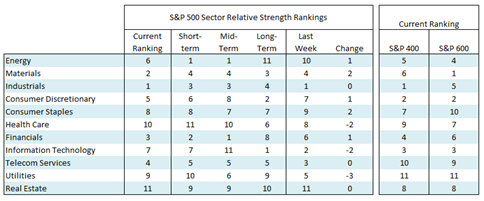
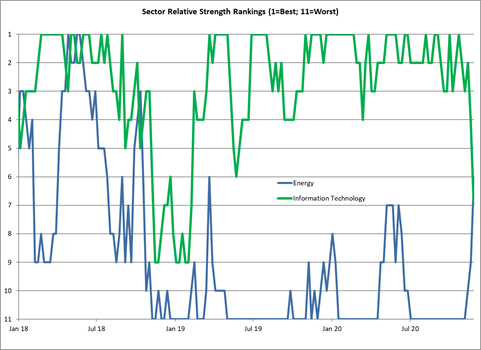
Sector rankings continue to move toward cyclical leadership at the large-cap level, with more mixed trends among mid-caps and small-caps. Industrials, Materials, and Financials are in the top three spots, and for the first time in over two years, Energy is ranked above Technology.
Bottom line: Even with bullish breadth, sentiment argues against getting aggressive right here. Rather, any near-term volatility that helps unwind optimism should probably be seen as an opportunity to get well positioned for the next leg of the cyclical bull market, adding exposure to small-caps, emerging markets and cyclical sectors.
Have a great week. Stay healthy. Tune out the noise.
Twitter: @WillieDelwiche
Any opinions expressed herein are solely those of the author, and do not in any way represent the views or opinions of any other person or entity.

: Cup (and Maybe Handle) Watch")
 Trading Near Top Of Price Range")

