Consumer behavior can tell you a lot about the stock market.
Sounds a bit funny, but it’s very true. And especially so when comparing buying of discretionary items versus buying of everyday staples items.
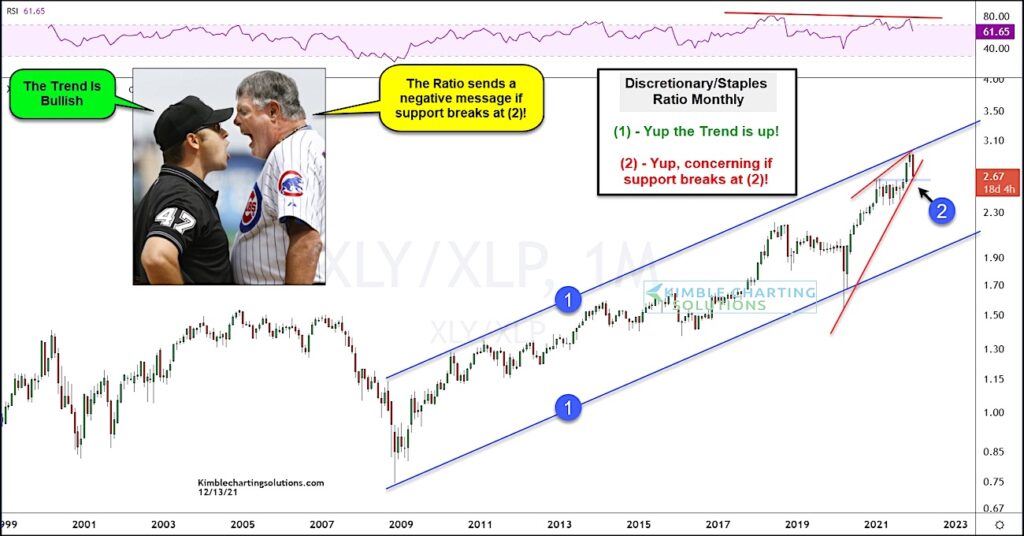
In today’s chart, we look at the long-term performance ratio of the Consumer Discretionary ETF (XLY) to the Consumer Staples ETF (XLP). When discretionary spending is out-performing, this ratio is headed higher and indicative of consumers being more willing to spend money (risk-on).
As you can see, the longer-term trend has been higher confirming a bullish trend (for the ratio, and the stock market). This is highlighted by the rising price channel at each (1).
BUT the ratio has turned sharply lower this month after testing the upper end of the price channel. It is now attempting a bearish reversal.
The decline currently has the ratio testing its up-trend line at (2). If support breaks at (2), it would send a bearish message to investors. Stay tuned!
Consumer Discretionary ETF (XLY) vs Staples ETF (XLP) “monthly” Ratio Chart
Note that KimbleCharting is offering a 2 week Free trial to See It Market readers. Just send me an email to services@kimblechartingsolutions.com for details to get set up.
Twitter: @KimbleCharting
Any opinions expressed herein are solely those of the author, and do not in any way represent the views or opinions of any other person or entity.
: Cup (and Maybe Handle) Watch")
 Trading Near Top Of Price Range")
 Reaches Important Price Support")