We kicked off the new year of 2024 with an overheated stock market, excessively bullish breadth indicators, and euphoric sentiment levels. While the first week in January felt like a “wake-up call” pullback for awestruck bulls, last week saw the S&P 500 push right back up to all-time highs.
Leading growth names like META are making new all-time highs. Will the S&P 500 and Nasdaq 100 follow suit, or is this the last gasp higher in a double top pattern for the major market averages?
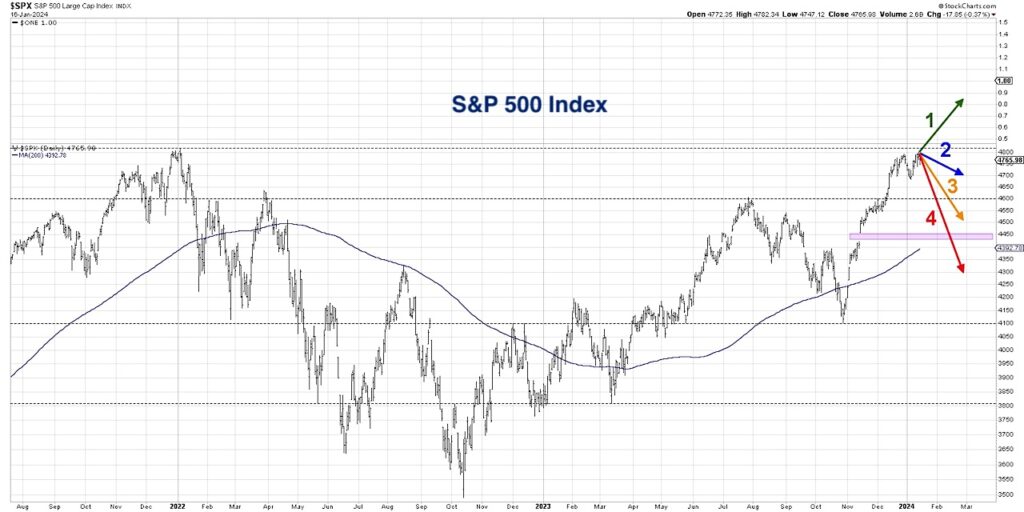
In today’s “choose your own adventure” style video, we’ll break down four potential scenarios for the S&P 500 index over the next 6-8 weeks. Using technical analysis tools, we’ll lay out the key levels to watch and discuss some of the macro trends and leadership themes that would most likely accompany each scenario.
- What would cause the S&P 500 and Nasdaq 100 to achieve new all-time highs in Q1, and which stocks and sectors stand to lead the charge higher?
- How could rising interest rates temper bullish sentiment, and cause the major benchmarks to stall out for a retest of recent price support?
- What guideposts could help us identify deteriorating market conditions to minimize capital loss in a bearish scenario?
Watch the breakdown of the four scenarios, then cast your vote. Which scenario do you see as most likely, and why?
[Video] S&P 500 Potential Pathways Forward
Twitter: @DKellerCMT
The author may have positions in mentioned securities at the time of publication. Any opinions expressed herein are solely those of the author, and do not in any way represent the views or opinions of any other person or entity.


