Stocks began the day weak, and weaker than most traders probably realized. As you can see in the intra-day chart below, short-term momentum, as measured by Real Motion, had rolled on Monday.
As a result, when the S&P 500 Index ETF (SPY) broke its 30-minute Opening Range low (as shown in the chart below), it accelerated lower.
The pattern to notice in the SPY chart above is the divergence in Real Motion’s two moving averages vs. the same moving averages in the price chart. The day began with the Real Motion averages negatively stacked (the 50 in blue, under the 200 in green). The is weak momentum, even when the price moving averages aren’t negative (yet).
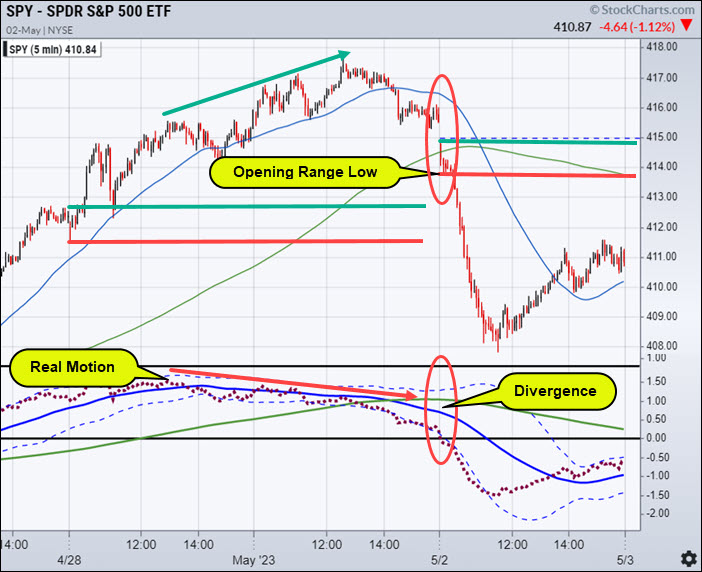
When this divergence occurs, Opening Range breakdowns tend to follow through as it did Tuesday.
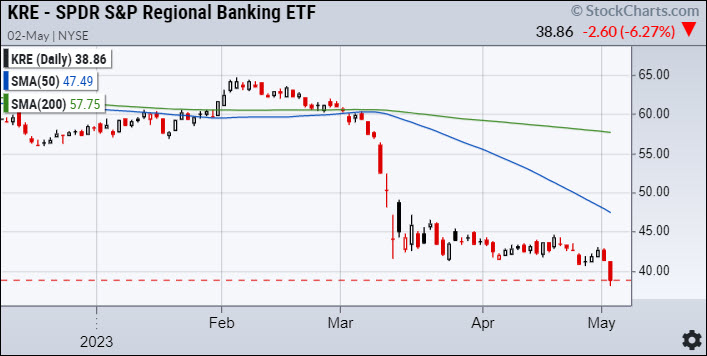
Today was particularly bearish as there were good reasons for stocks to be under pressure. Regional banks broke down to new year-to-date lows, and the crude oil ETF, USO, had its biggest down day since July 2022. This dragged down energy stocks and stoked fears of economic slowdown.
Adding to the uncertainty, the Fed will make its interest rate decision tomorrow.
Flight to safety and worsening fears of economic slowdown were confirmed by the big rally in the long bond ETF, TLT.
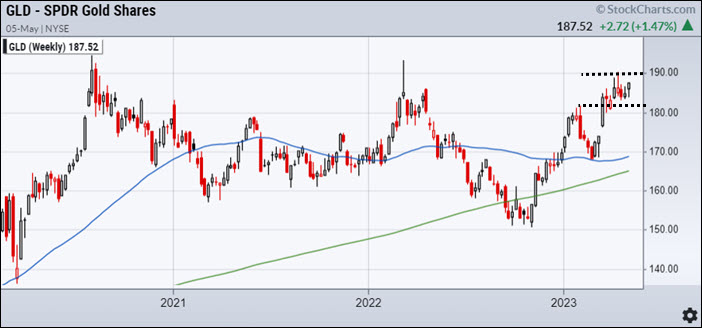
Wednesday gold may be the biggest mover.
Gold is often referred to as the asset that rises and falls with inflation, but gold’s favorite time to shine is in periods when markets lack confidence in the monetary system.
Today the market’s mood with respect to the regional banking system went from bad to worse, as exemplified by the action in the KRE and the XLF.
Tomorrow, the Fed will likely raise rates again, which is expected. However, if Chairman Powel’s remarks create a further loss of confidence in the Fed’s ability to navigate the worsening banking crisis, economy, and inflation risks, the weekly gold chart (below) is ready to shine.
Stock Market ETFs Trading Analysis & Summary:
S&P 500 (SPY) 23-month MA 420
Russell 2000 (IWM) 170 support – 180 resistance
Dow (DIA) Over the 23-month MA-only index
Nasdaq (QQQ) 329 the 23-month MA
Regional banks (KRE) 43 now pivotal resistance
Semiconductors (SMH) 246 the 23-month MA
Transportation (IYT) 202-240 biggest range to watch
Biotechnology (IBB) 121-135 range to watch from monthly charts
Retail (XRT) 56-75 trading range to break one way or another
Twitter: @marketminute
The author may have a position in mentioned securities at the time of publication. Any opinions expressed herein are solely those of the author and do not represent the views or opinions of any other person or entity.

: Showing Some Signs of Emerging Strength")
