The news about the Silicon Valley Bank failure has rocked the financial markets and sent significant worries through system.
Is this it? How many more banks?
Rising interest rates have hurt long-term treasury bond investments and this may be the headwind that smaller banks are facing.
Today we take a look at a long-term chart of the Russell 2000 ETF (IWM) and what we are seeing.
Note that the following MarketSmith charts are built with Investors Business Daily’s product suite.
I am an Investors Business Daily (IBD) partner and promote the use of their products. The entire platform offers a good mix of tools, education, and technical and fundamental data.
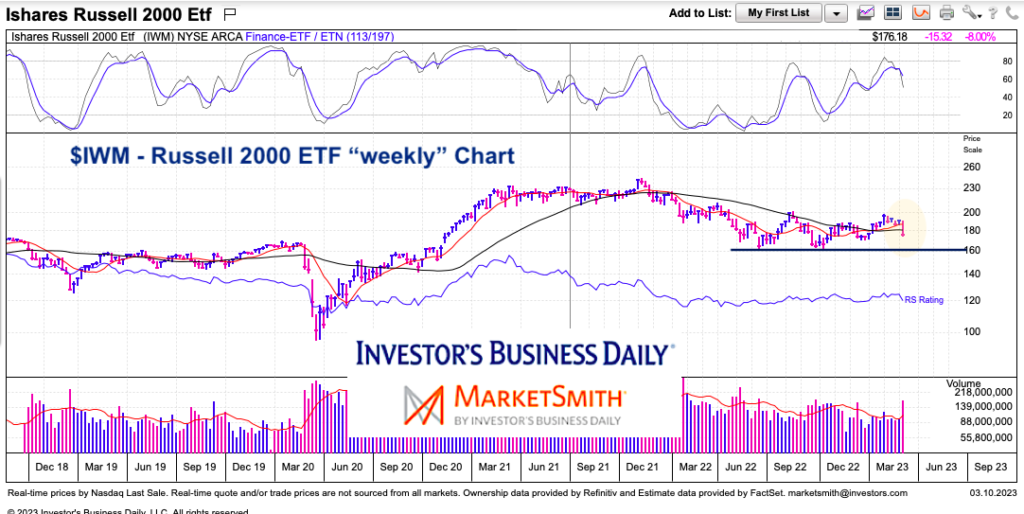
$IWM Russell 2000 ETF “weekly” Chart
Pretty simple here. The banking crisis has sent the small cap index into a sharp decline. The move lower has taken out the 10 and 40 week moving averages.
Now we are focused on the 2022 lows and critical support around $160. A closing below this level may signal a bigger crisis.
Twitter: @andrewnyquist
The author may have a position in mentioned securities at the time of publication. Any opinions expressed herein are solely those of the author, and do not in any way represent the views or opinions of any other person or entity.


