Hello 2016, goodbye bull market. Or is it just another market correction?
Markets move in 3 directions: up, down and sideways. Let’s go take a look at the charts for clues on what this first 2 weeks of 2016 is telling us about the stock market.
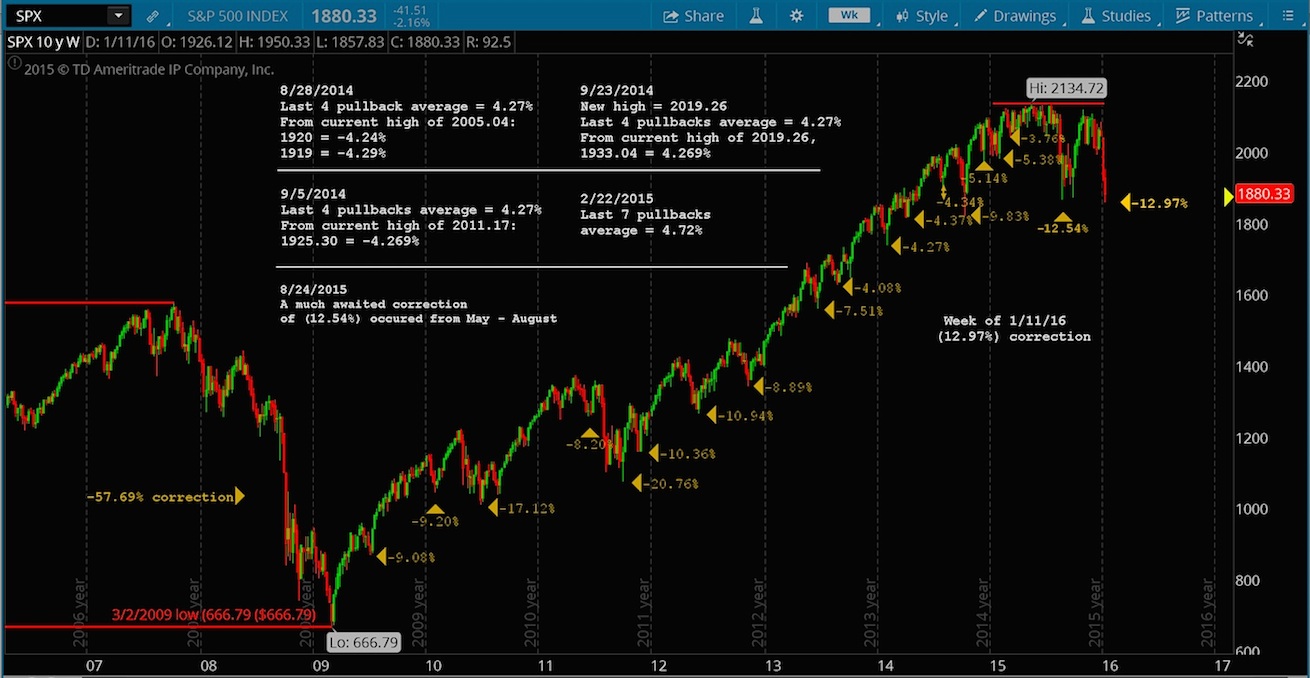
Let’s start with a longer term, big picture chart of 10 years highlighting the many market pullbacks and market corrections. In the chart below, you’ll see where the raging bull market began its stampede in Q1 2009. The move from low to high was an impressive +220.14% with shallow pullbacks becoming the norm starting in August of 2013. For the next 2 years the pullbacks averaged in the mid 4 percent range.
As noted on the chart, the 2 most recent market corrections were 12.54% and 12.97%.
S&P 500 Index – 10 Year, Weekly Chart
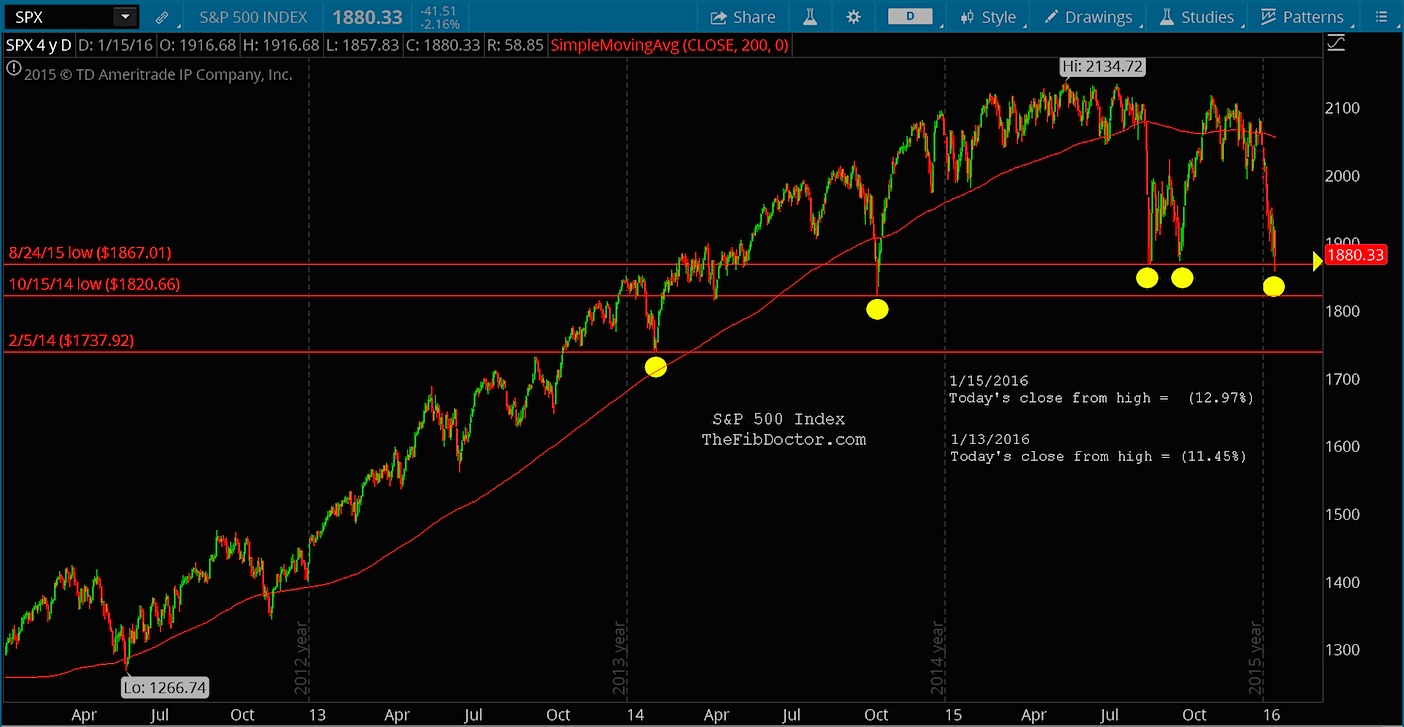
In the S&P 500 chart below, I’ve drilled down to a shorter time frame of 4 years to find areas of support. There are 3 levels that I’ve given extra weight to as far as strong support; 1867.01, 1820.66 and 1737.92
- On August 24th, 2015, price made a low of 1867.01, moved up +8.24% before falling back very close to the previous support, making a low of 1871.91 before moving back up a respectful +13.06%.
- On October 15th, 2014, price made a low of 1820.66 and then moved up +14.21%.
- On February 5th, 2014, price made a low of 1737.92 and then moved up +8.38%.
S&P 500 Index – 4 Year, Daily Chart
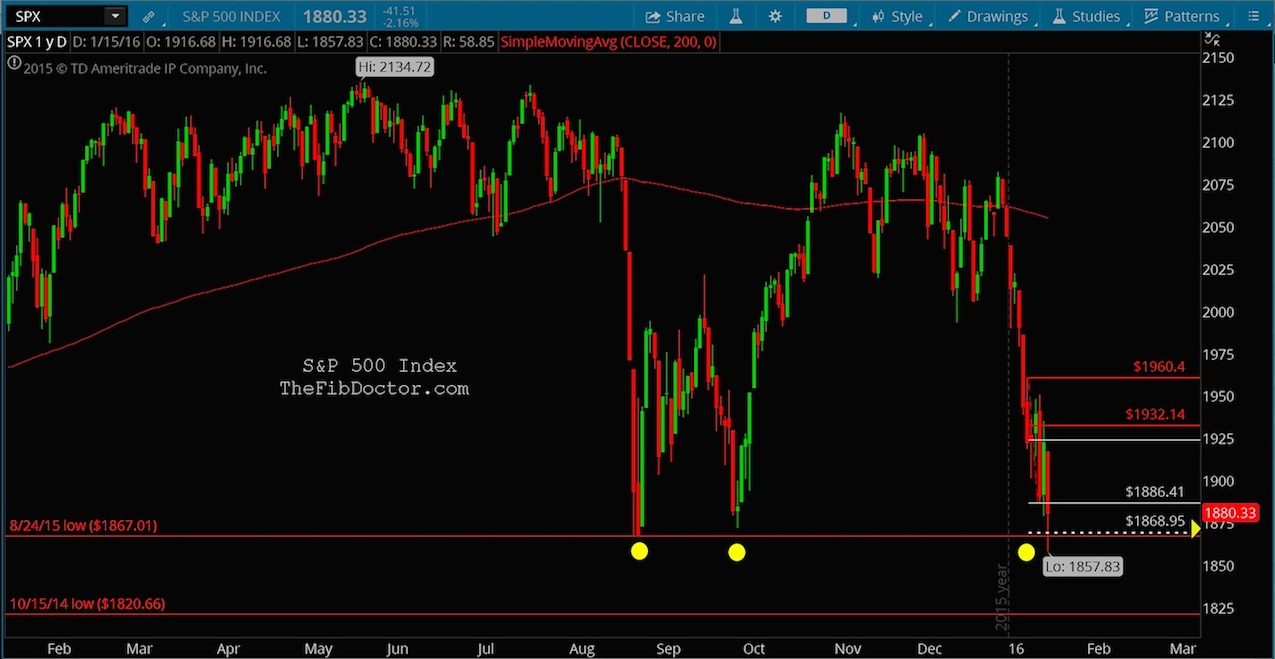
Now, using my Fibonacci technique, let’s see if we get any fibonacci levels that coincide with those support levels. In the chart below, you’ll see a target of 1868.95 which was hit on Friday, January 15th, 2016, but was not closed. Price fell slightly under that target and the August support level before buyers pushed it back up to close at 1880.33.
From here, you’ll want to monitor this closely for a daily candle CLOSE below 1867.01. That would open the door for another 47 point drop easily. Or, if price can push up from here, 1932.14 is the level you want to see price push through, with substantial volume.
S&P 500 Index – 1 Year, Daily Chart
Be careful out there. Thanks for reading.
Continued reading by Dave: Is The Russell 2000 Index Entering A Bear Market?
Twitter: @TheFibDoctor
No position in any of the mentioned securities at the time of publication. Any opinions expressed herein are solely those of the author, and do not in any way represent the views or opinions of any other person or entity.


