Last month marked a historic first, although it was a rather quiet entrance. Reversing course from the money printing programs of QE1, QE2 and QE3, the Federal Reserve pulled $10 billion from the capital markets.
I call it ‘money destruction,’ since it is the exactly opposite of ‘money printing.’
The Federal Reserve will pull another $10 billion for the next 2 months. Then starting in January, it will pull $20 billion per month out of the capital markets for 3 months. That amount then increases by $10 billion per quarter until it reaches the cap of $50 billion per month in October 2018.
The economy, by any measure, remains healthy, and many businesses are cheered by the Republican tax and regulatory climate. Given the upcoming Fed withdrawals from our capital markets, I remain less than sanguine about average stock performance in 2018. At a maximum pace of $600 billion annually ($50 billion per month), the Fed actions will likely have a significant effect on bond and stock markets, although there is no precedent to know exactly where and when the effects will become apparent.
Stocks & Bonds
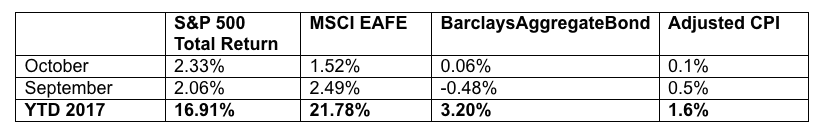
Although seasonality tends to slow the stock market for a period in October/November, that was not the case in 2017. U.S. and global equities have continued to climb higher, and various gauges show that investor optimism is near previous highs. The S&P 500 (INDEXSP:.INX) is at all time highs.
Bond yields are holding firm (yet subdued), even as the Federal Reserve began to sell its Treasury holdings in October. Inflation remains muted, and overall unemployment remains low. Here are the numbers:
Commodities & Currencies
Oil prices have been climbing higher as geopolitical concerns have come back to the forefront. The investing environment around the safe-haven of gold hasn’t been so kind. Gold prices (NYSEARCA:GLD) are still up marginally for the year, but under pressure of late.
The U.S. Dollar is trying to find a bottom, as the ECB will likely continue its easy-money policy for longer than expected. As well, tightening by the Federal Reserve may put in a floor.
Economy
The ISM Manufacturing PMI in October was 58.7%, slightly lower than September but still strong. The non-manufacturing, or services, index came in at 60.1%, also showing continued strong expansion. The Commerce Department released its advance estimate of third quarter growth, estimating that the economy grew at an annual rate of 3.0%. They also confirmed that the annual rate of growth in the second quarter was 3.1%.
The National Association of Realtors reports that existing-home sales in September 2017 were 1.5% lower than in September 2016. However, the median price rose 4.2% to $245,100 from a year earlier. Median home prices have now been rising for the past 67 months. Distressed sales (foreclosures and short-sales) were just 4% of total sales in September, unchanged from last month and also last year.
Data Sources:
www.standardandpoors.com – S&P 500 information
www.msci.com – MSCI EAFE information
www.barcap.com – Barclays Aggregate Bond information
www.bloomberg.com – U.S. Dollar & commodities performance
www.realtor.org – Housing market data
www.bea.gov – GDP numbers
www.bls.gov – CPI and unemployment numbers
www.commerce.gov – Consumer spending data
www.napm.org – PMI numbers
www.bigcharts.com – NYMEX crude prices, gold and other commodities
Any opinions expressed herein are solely those of the author, and do not in any way represent the views or opinions of any other person or entity.

: Showing Some Signs of Emerging Strength")

