Ah, the VIX. Everyone’s favorite fear/greed instrument, but in reality it is probably one of the most misunderstood things in all of finance.
So many have incorrectly (for years now) said a low VIX is bearish, because it shows everyone is complacent. This just isn’t true. The Volatility Index (VIX) is simply a measure of how much traders are willing to pay for various S&P 500 options over the next 30 days.
I enjoy talking about the VIX and I’ve done it a few times lately. Last week I examined the huge spike on Thursday and a few weeks ago broke down what usually happens in July for the VIX. This piece is going to be a much bigger picture look at why I think the VIX will stay low for a long time.
And just what is a ‘low VIX’? Back in mid-2012 when the VIX was around 20, the masses were up in arms saying that was ‘too low’. Exactly two years ago on Yahoo Breakout I made a call the VIX would go to the low teens. This was a call that nearly no one thought would happen. Now if you know about those Yahoo message boards, they can be pretty rough and I can honestly say I never received more hate for a call – ever. That right there told me I was probably right. The market has a funny way of not making the masses happy.
For years now we’ve seen continued record calls trade on the VIX, a new volatility-based ETN show up nearly every month, and just an incredible appetite to be hedge against future volatility. This trade has been a contrarian’s dream. I get it, most have been scared by 2008 and there is nothing wrong with buying insurance. Still, don’t be shocked if the VIX stays low for another couple years.
In late 2012, I said the VIX could stay low potentially years. At the time it had been beneath the critical 20 area for about six months. Again, this seems obvious now, but at the time you were looked at funny for calling for something this unpopular.
Going back to 1990, the VIX has averaged exactly 20.0. I think that is pretty telling. Above 20 and you see a lot of volatility and usually that equates to a lower stock market. A VIX beneath 20 and usually the market trends higher. Now it is nearly quite that simple, but this is where things get interesting. It might average 20 over a very long time frame, but it actually rarely trades near this level. In fact, just 20% of the time does the VIX trade between the 18 and 22 levels. Breaking it down a little more, 41% of the time it is above 20 and 59% of the time it is below. In summary, the VIX might average 20, but usually spends most of its time far away from that average.
Finally getting to the chart, you can see the VIX was recently down near that 10 area which has marked major lows going back two decades.
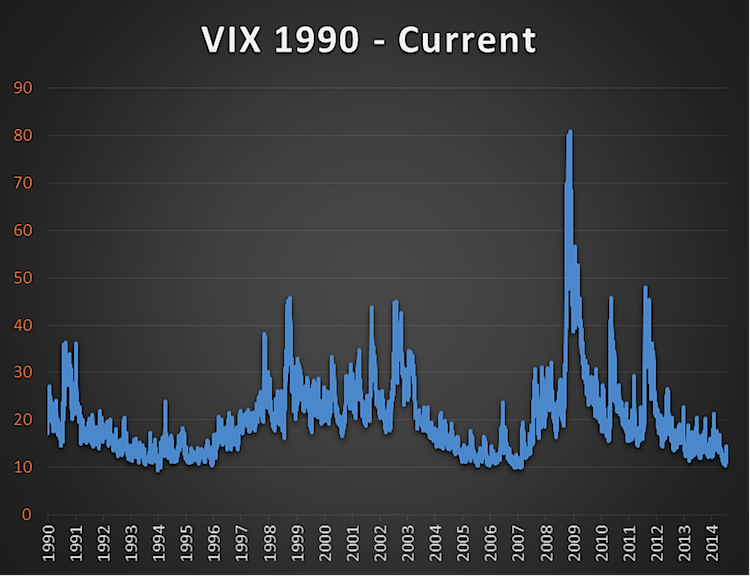
But that doesn’t mean it has to spike from 10 to 50 overnight. Here’s the one chart that I’ve used for nearly two years now that says the VIX will probably stay beneath the 20 area for years. Remember, we’re two years into this low volatility world and my best guess is we have a least a few more years left.
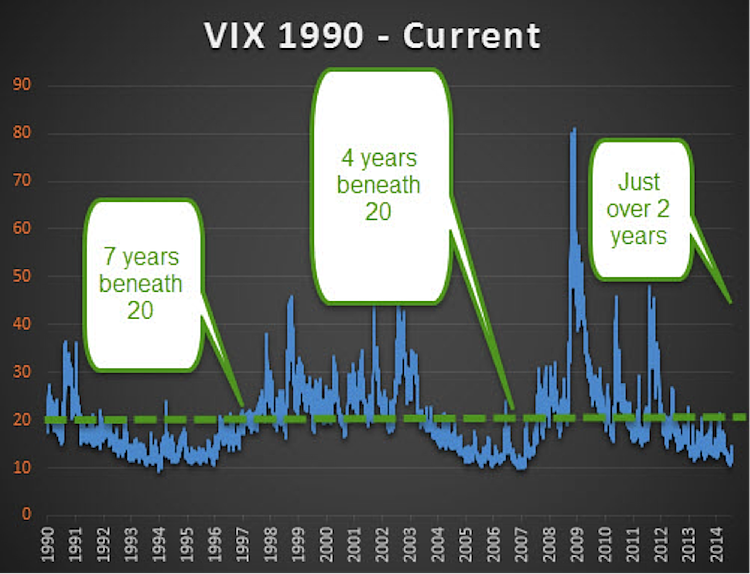
For seven years in the ’90 and another four years last decade the VIX was beneath 20. In between it spent multiple years above this 20 area. Well, we’re two years into this cycle and my money says it’ll stay here for a while longer.
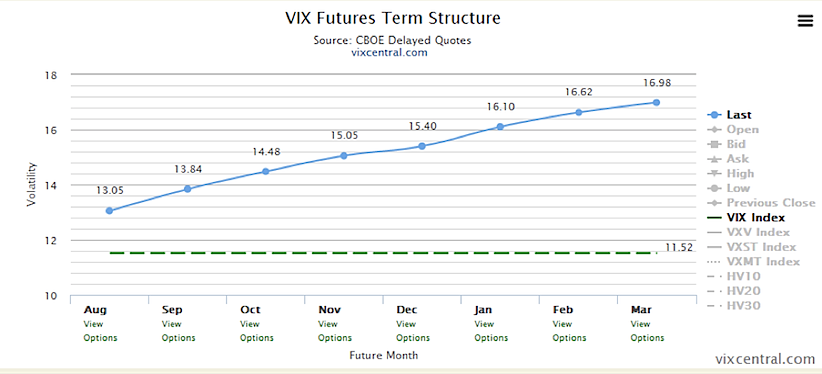
Check out the VIX term structure. Option players are willing to pay more for future months, or betting on higher volatility as we go out into the future. This makes sense, as volatility is very low and could have a big surge at any time. In fact, this is what you usually see from the VIX futures crowd. The only problem is the term structure looked just like this at the start of the year as well and most of last year’s record run. In other words, this set up hasn’t produced the elusive volatility spike so many have been expecting, trying to guess it now is a pointless game in my opinion.
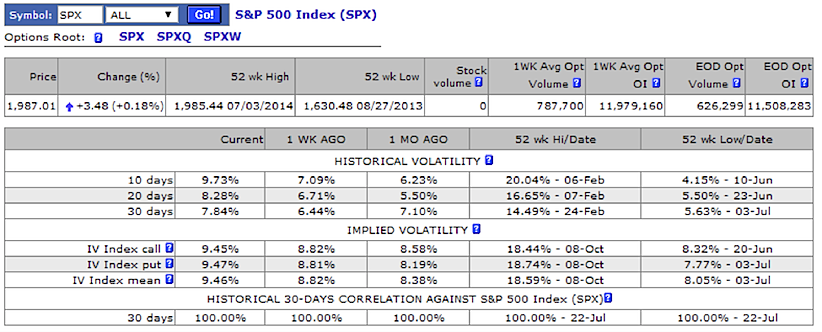
One other thing I like to point out when trying to determine what exactly a ‘low VIX’ is –you have to compare it to something relevant. Now the VIX looks at future volatility, so I like to compare it to actual (or historical) volatility. Using data from IVolatility, you can see that historical volatility on the SPX is also extremely low. This is a more of an apples-to-apples comparison. So the VIX is low, but so is realized volatility on the SPX – what’s the big deal? I don’t know, makes sense to me. Maybe a VIX of 11 isn’t that low when SPX volatility is also low. Just my opinion and some might disagree, but I see no major warnings.
My big worry now is if people start to agree with me that volatility will remain low for years. That could be a sign I’m wrong, but for now I’ll stick with the call that the VIX will stay low for a much longer time than nearly anyone thinks. We’ll see spikes up near that 20 area, but those are healthy and needed to shake out the weak hands.
Thanks for reading and good luck out there.
No position in any of the mentioned securities at the time of publication. Any opinions expressed herein are solely those of the author, and do not in any way represent the views or opinions of any other person or entity.


 Testing Important Price Support")


