Last Friday the market closed on a high note with a rally off the lows of 05/12.
This was a bullish sign, yet the rally also pushed prices into a resistance area.
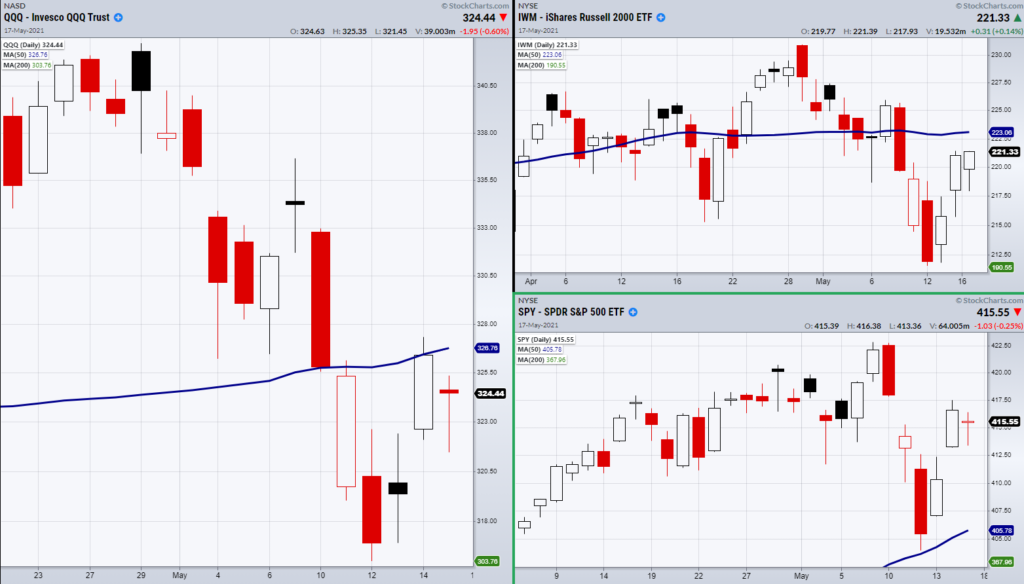
The mixed sentiment from traders can be seen in today’s major indices with an inside day pattern found in the Russell 2000 (IWM) and the S&P 500 (SPY).
An inside day pattern is created when the total range of a price candle fits within the prior days’ range.
This creates an easy way to watch for either a breakout or breakdown based on resistance/support from the prior days high/low.
However, a clean break over Friday’s high brings the market back into a choppy area, while a drop past Friday’s lows would have investors looking towards the next key support area to hold from 05/12.
Additionally, the Nasdaq 100 (QQQ) has resistance not only from Friday’s highs but also from the 50-Day moving average found at $326.84.
As seen in the charts above this gives us key levels to watch for a break over with a clean support area to hold if bullish sentiment prevails.
Stock Market ETFs Summary & Analysis:
S&P 500 (SPY) Held the 10-DMA at 415.25.
Russell 2000 (IWM) Support 215. Resistance 223.17.
Dow (DIA) Like this to hold over 342.43.
Nasdaq (QQQ) 326 resistance.
KRE (Regional Banks) 71.82 resistance.
SMH (Semiconductors) 233 pivotal area.
IYT (Transportation) 282.40 resistance.
IBB (Biotechnology) 147.11 support.
XRT (Retail) 96.27 resistance.
Twitter: @marketminute
The author may have a position in mentioned securities at the time of publication. Any opinions expressed herein are solely those of the author and do not represent the views or opinions of any other person or entity.


