On March 26, I wrote a daily market update called: Swiss Franc Currency Decline Nears Pivot Support.
When I awoke and looked at the charts, I noticed in the futures market is that CHFUSD (Swiss Franc to the US Dollar) has been in a freefall for a while.
On the monthly chart, the Swiss Franc Currency ETF (FXF) has moved closer to the 23- and 80-month moving averages.
Even more importantly, the price has been above both MAs since a year ago.
With long bonds yields softening a bit and the US dollar coming off its recent highs, I thought it might be fun to revisit this dream and update you on the current daily chart analysis.
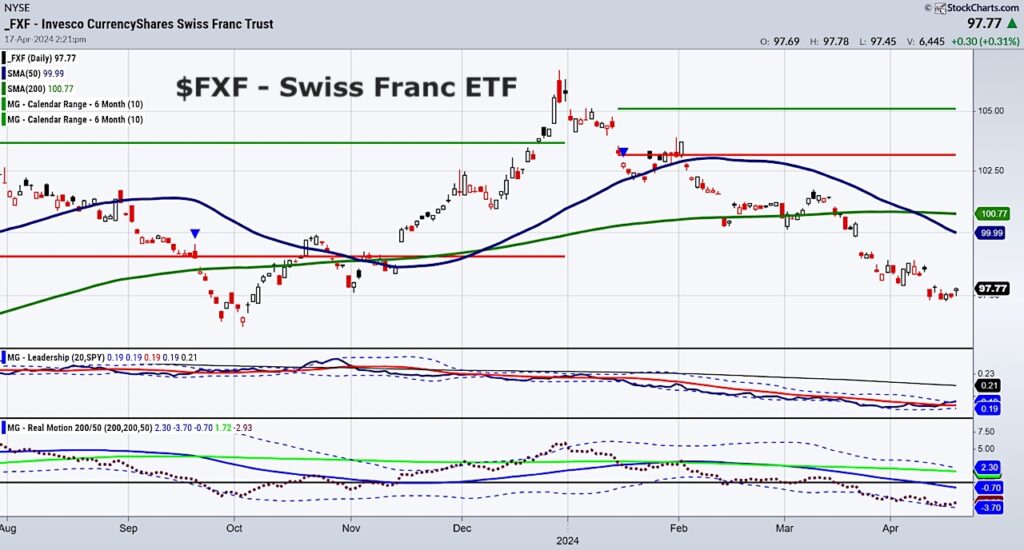
First off, FXF is holding the October 6th low over 97.00.
Secondly, FXF is now outperforming the benchmark or SPY.
Thirdly, our Real Motion Indicator tells us that FXF had a mean reversion.
Finally, on April 15th FXF made a new 60+ day low followed by an inside day, with today’s action closing above the highs of both days.
Reversal pattern?
Ideally, we would like to see FXF get back over and close the week out over 98.10 or the 200-WMA.
Twitter: @marketminute
The author may have a position in mentioned securities at the time of publication. Any opinions expressed herein are solely those of the author and do not represent the views or opinions of any other person or entity.

: Worrisome to Broader Market?")
