 As Crude Oil prices retest the 2015 lows, the Philadelphia Oil Service Sector (OSX) nears its own important price level – a 15 year trend support line. The Oil Service Sector is largely dependent on elevated (and stable) Crude Oil prices and has taken quite a tumble along with Oil.
Below are two charts that highlight why we may see a bounce in the Oil Service sector and select oil service stocks.
Looking at the charts below for reference, here are a few major takeaways:
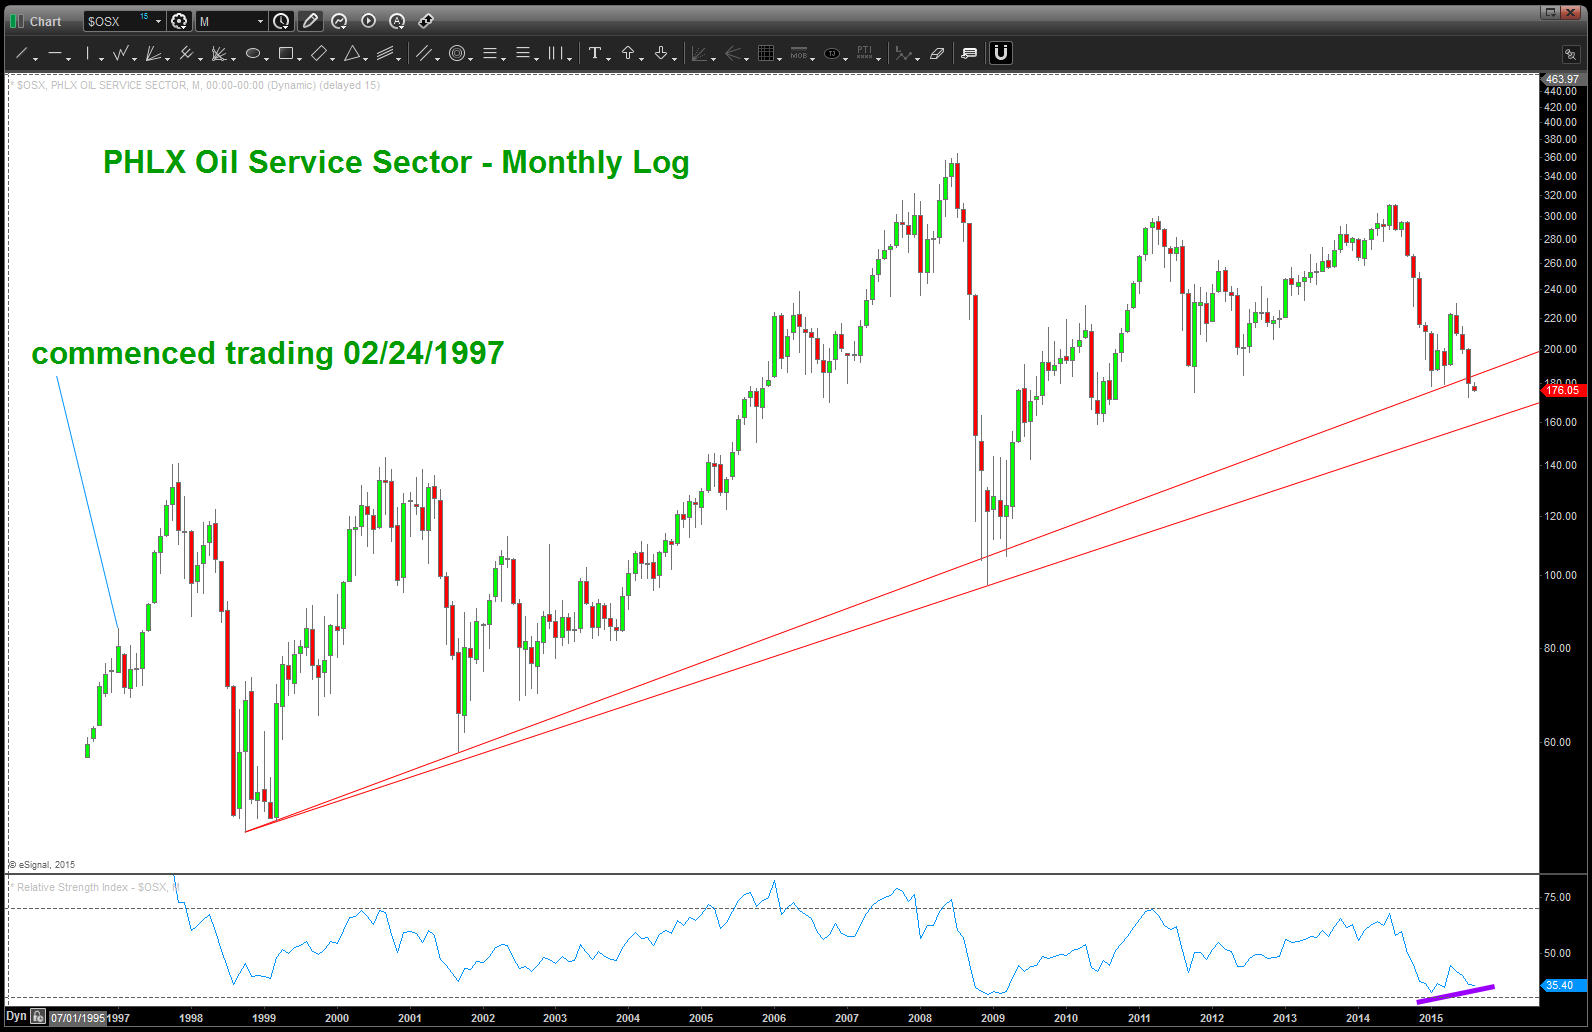
- On the Log Chart you can see that the Oil Service Sector is touching the long term trend line that was created from the all-time lows in 1998. The OSX briefly went thru it but appears to be finding support. A definitive close below this trend line on the monthly chart would be very bearish (in my opinion). That said, one would expect some support after 18 years.
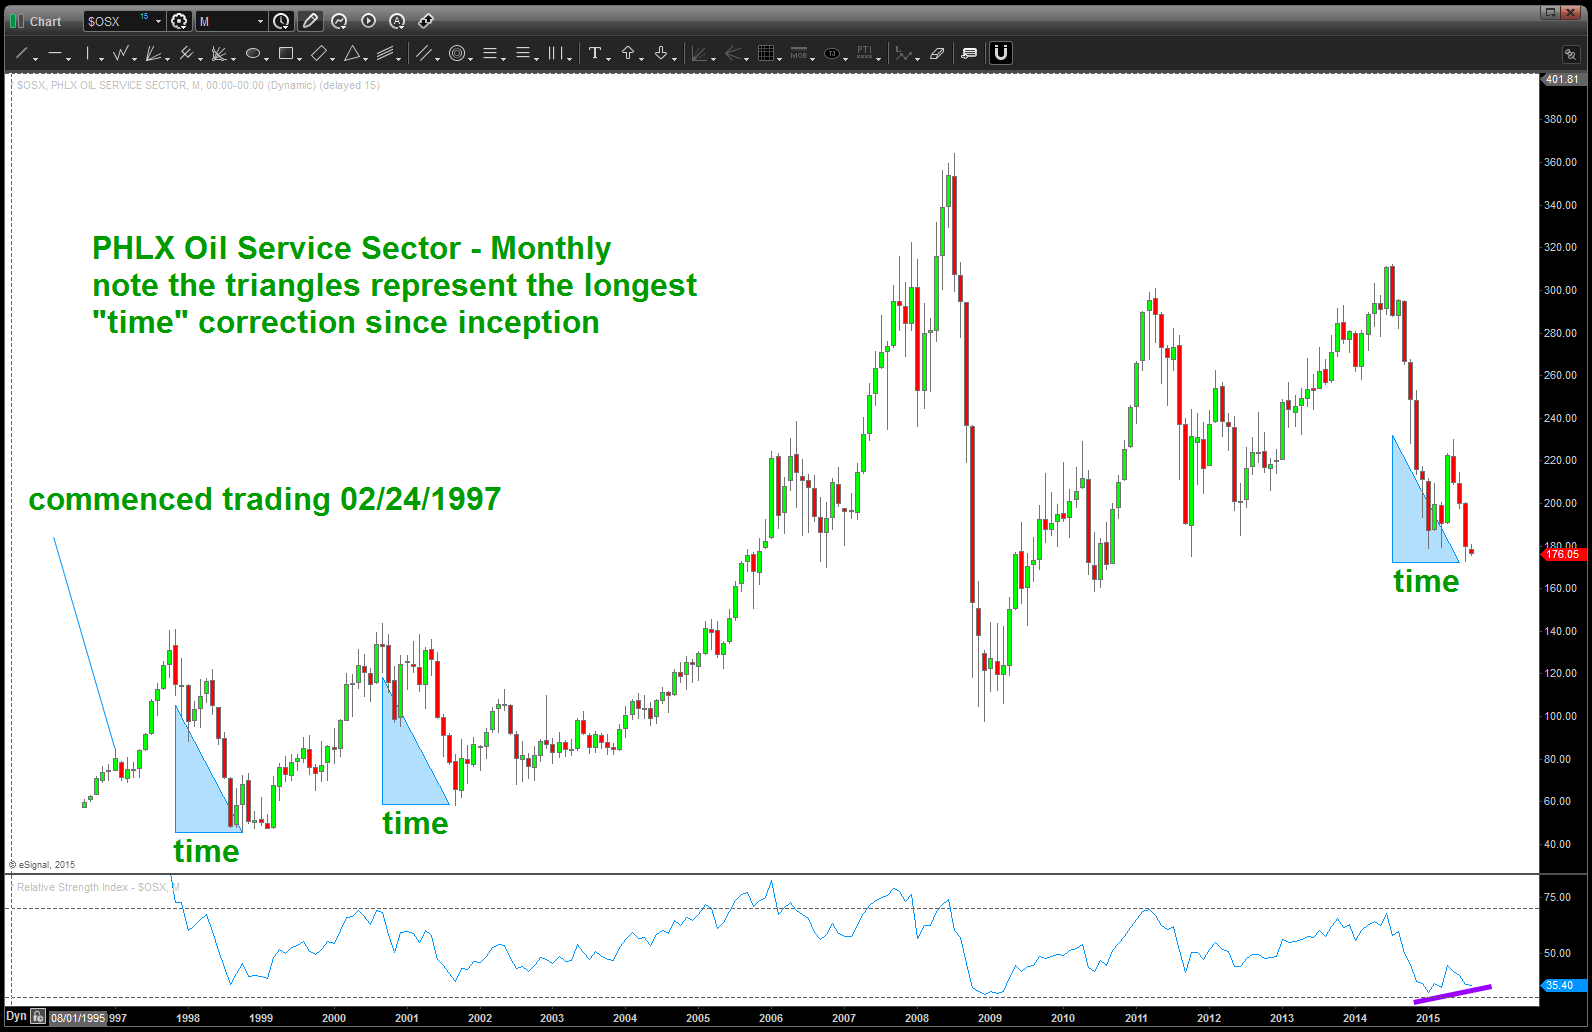
- Note we have completed, this month, the longest “time” correction during this period. This is represented by the blue triangles.
- Along with the “time” component we have a Monthly bullish divergence on the 14 period Relative Strength Index (RSI) at the lower end of the range. It hasn’t been this low since 2009 and there was a noticeable bullish divergence as the index made new lows this month.
Thanks for reading and have a great week.
Twitter: @BartsCharts
Author does not have a position in mentioned securities at the time of publication. Any opinions expressed herein are solely those of the author, and do not in any way represent the views or opinions of any other person or entity.


