This morning Sony (SNE) upped their 2015 guidance and the stock is reacting positively pre-market, trading over $25 per share at the time of this writing. With that in mind, I’d like to share a few technical developments that have the potential to create a perfect storm for Sony shares and shareholders.
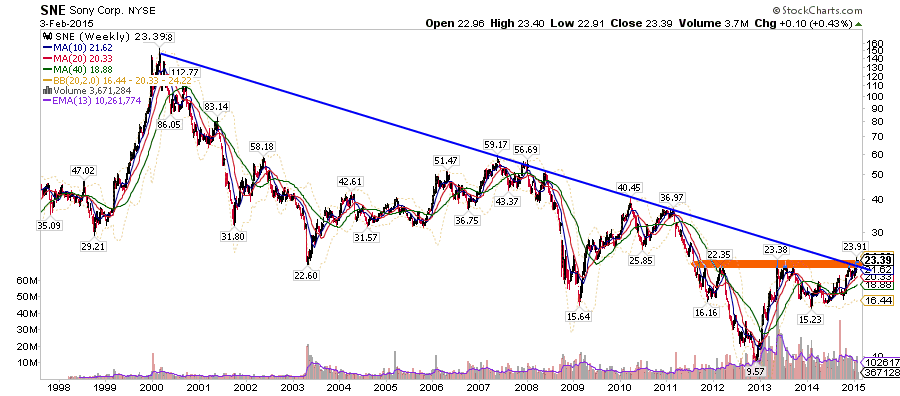
The $23 level has been resistance for 40 months. At the same time, it’s breaking the resistance trend line from the 2000 peak.
Sony Stock Chart (SNE) – Long Term
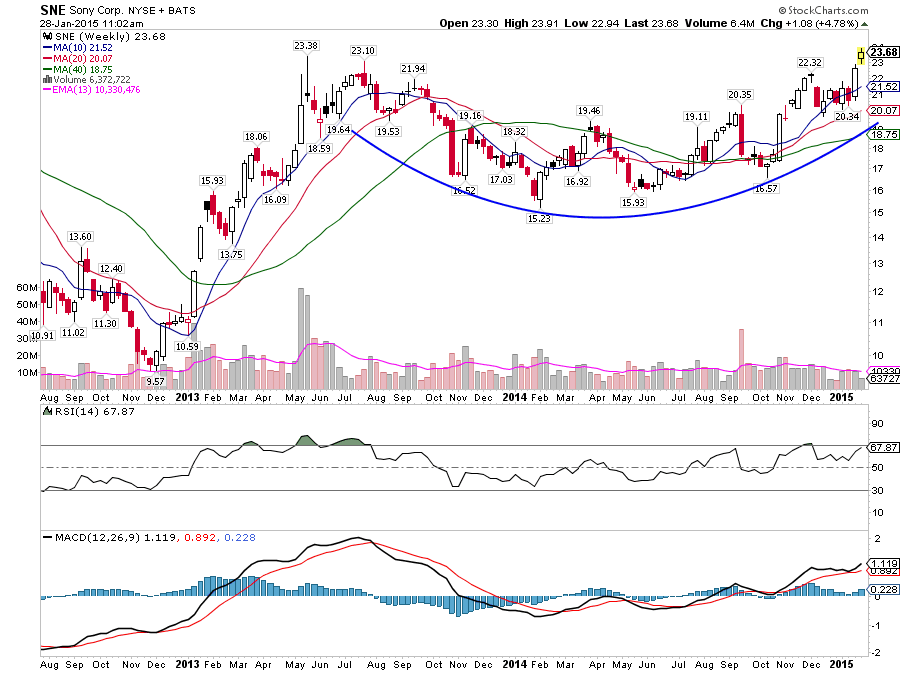
Zooming in we see SNE has left what could be called a cup with handle base. It measures to 31 or so. It’s also important to note that all of the moving averages are now trending higher.
Sony (SNE) – Near Term Chart
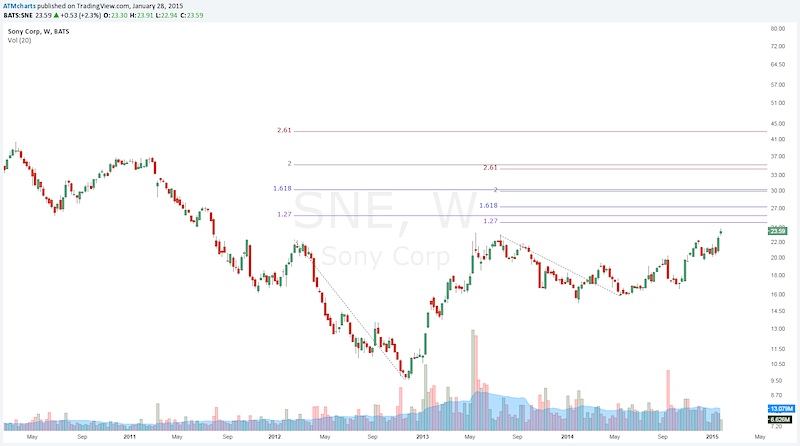
Looking at the fib extensions from this area, we also see a confluence at the 30 area. Sony stock could go significantly higher, but all in all, 30 looks like a great main target area.
Sony Fibonacci Retracement Levels To Watch
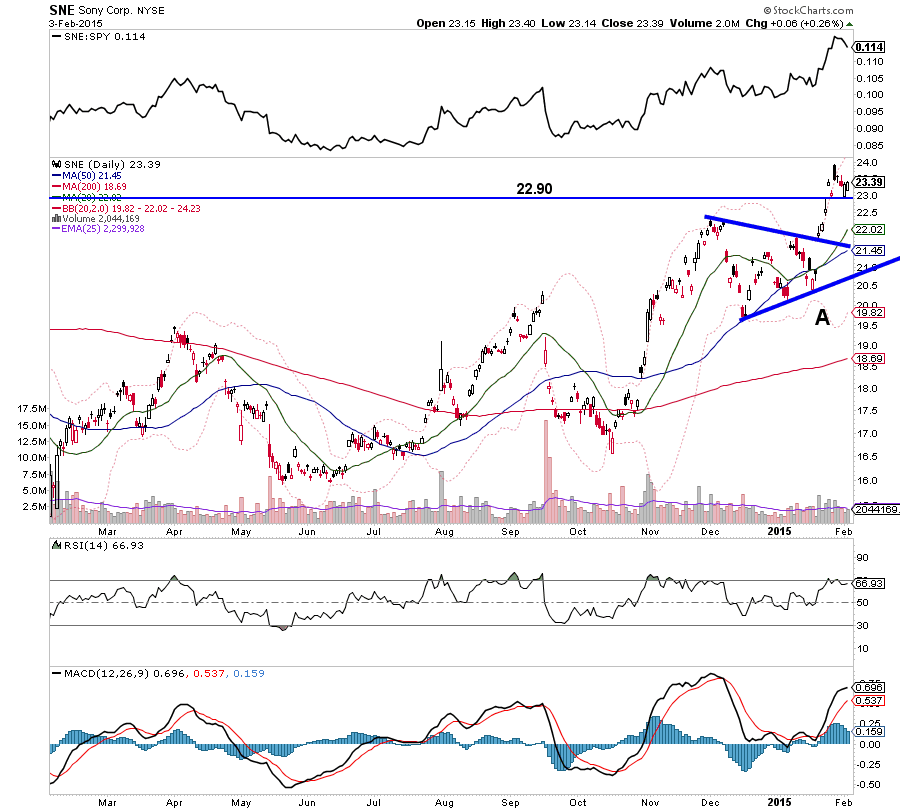
The main question is where an appropriate stop level would be the prior tradable low at 22.90. Of course we can always wait for a consolidation or base to build and trade against that. Always remember, patience pays!
Sony “ZOOM” Chart
Thanks for reading!
Follow Aaron on Twitter: @ATMcharts
No positions in any mentioned securities at the time of publication. Any opinions expressed herein are solely those of the author, and do not in any way represent the views or opinions of any other person or entity.

: Worrisome to Broader Market?")
