It’s been a wild ride for the Nasdaq Composite. After rallying over 20 plus percent in just over four months, the Index hit the big round 5000 number on March 2nd. But as the Nasdaq was making new 52 week highs this year (and closing at all-time monthly highs), another big name tech stock was not. That large cap would be Microsoft (MSFT). And this divergence is likely a sign of weakness for Microsoft stock.
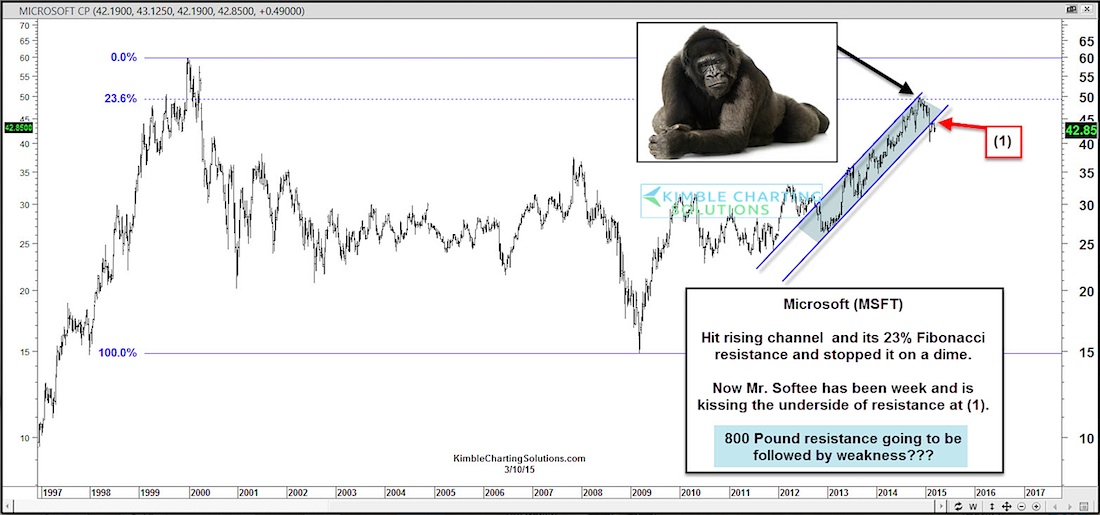
To better understand what happened and how that may effect risk exposure to Microsoft stock, let’s take a look at the chart (see below). The rally off Microsoft’s 2009 price lows recently saw its stock touching an important Fibonacci retracement level based upon the 2000 highs and 2009 lows. At the same time, Microsoft was also hitting the top of its rising trend channel. Note that this convergence of resistance stopped the advance in its tracks and lead to further weakness.
It’s also notable that MSFT broke below its rising trend channel support. And more recently the stock rallied back to kiss/backtest the underside (pt. 1 on the chart). If Microsoft is going to get back on solid ground, it will need to climb back into its rising trend channel.
Microsoft Stock Chart – Multi-Year View
Either way, the early year divergence was a “tell” of impending weakness. If Microsoft’s stock price doesn’t pick up the pace here and now, it may be called Mr. Softee by investors. Thanks for reading.
Follow Chris on Twitter: @KimbleCharting
Author does not have a position in any mentioned securities at the time of publication. Any opinions expressed herein are solely those of the author, and do not in any way represent the views or opinions of any other person or entity.


