Nearly all technical analysts of stocks and other securities make use of technical indicators to help them make trading and investing decisions.
Technical indicators are created by applying some mathematical calculation or function to the price and volume data of an underlying security. Technical analysts frequently compare the behavior and structure of indicators with the actual price and volume information. Today, I’d like to focus on market divergence signals – what are they, why they don’t always work, and some guidelines for how we can use them as active investors in today’s market.
Divergence Defined
Comparing the two lines gives rise to the concept of “divergence” – a situation where the price of a security is moving in one direction and the indicator in the other.
A significant market divergence signal is regarded as a reliable sign of a pending price trend change. For example, if the price of a security is trending down, while an indicator has started moving higher, technical analysts will conclude that the price of the security is about to reverse and start moving higher as well.
The following is a chart from Investopedia illustrating the concept:
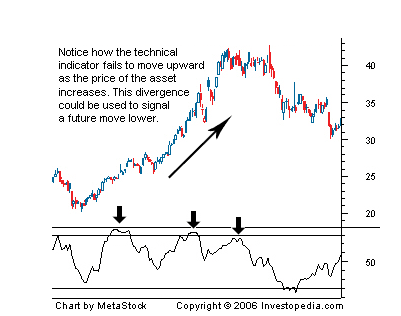
For more information on divergence, check out this link from Investopedia.
Pitfalls of Divergence
Unfortunately, market divergence indicators happen to be the most overused and poorly understood technical concept, leading many traders to make wrong decisions about the status of the market or the likely direction of a security.
In the last 3-4 years, instances of “negative divergence” have repeatedly been cited as the reason for a pending stock market top by many bearishly inclined analysts.
To illustrate what I mean, please see the chart below. It compares the price action of the S&P 500 on the weekly timeframe with MACD, one of the most widely followed indicators. As you can see, in the last four years there have been at least five (5!) instances of significant negative divergence.
In hindsight, it is clear that every single instance of negative divergence above was meaningless in predicting a major trend change. The S&P 500 continued to grind higher and negative divergences were not indicative of a top, but rather marked periods of sideways consolidation when price advance slowed down.
This phenomenon is not unique to the MACD indicator. Here is the same comparison of the S&P 500 price action with RSI, another popular indicator.
There are literally hundreds of indicators out there, many showing similar negative market divergence structure over this time period.
For the last example I will use a secondary indicator called the “Price Momentum Oscillator” (PMO) because I think it illustrates very well the potential downside of making trading or investment decisions based on just one single indicator.
This example does not look dramatically different from the other two, but shows that the indicator peaked in January of 2014 and has been diverging from the price of the S&P 500 for almost a year and a half.
If you happen to be a trader who shorted the S&P 500 when this indicator started flashing divergence in the early 2014, I hope you learned a valuable lesson as the S&P 500 advanced more than 15% since then.
Conclusion
Here are some high-level guidelines for how traders should use indicators and approach market divergence:
- Only Price Matters – As mentioned above, nearly all indicators are derived from price and volume information. Your trading or investing decisions should always be driven by what the price is doing, while you can use an indicator to confirm or support the decision. It should never be the other way around.
- Know Your Indicator – If you are going to commit capital based on any indicator (even in the supporting role) make sure you understand how it is calculated and how it behaves under all market conditions. Most importantly, make sure you understand its limitations and conditions under which its reliability is suspect.
- No Edge In Divergence – As mentioned above, price-indicator divergences frequently produce false signals and should always be taken with a big grain of salt, especially in trending markets.
Thanks for reading!
Follow Drasko on Twitter: @NoanetTrader
No position in any of the mentioned securities at the time of publication. Any opinions expressed herein are solely those of the author, and do not in any way represent the views or opinions of any other person or entity.


 Testing Important Price Support")
")
