The climactic selloff and crash in bitcoin and other cryptocurrencies this week came as a surprise to many investors, but not if you paid attention to several key warning signs in recent weeks and months.
The chart of Bitcoin has shown classic bubble characteristics punctuated by bearish momentum divergences through most of 2021.
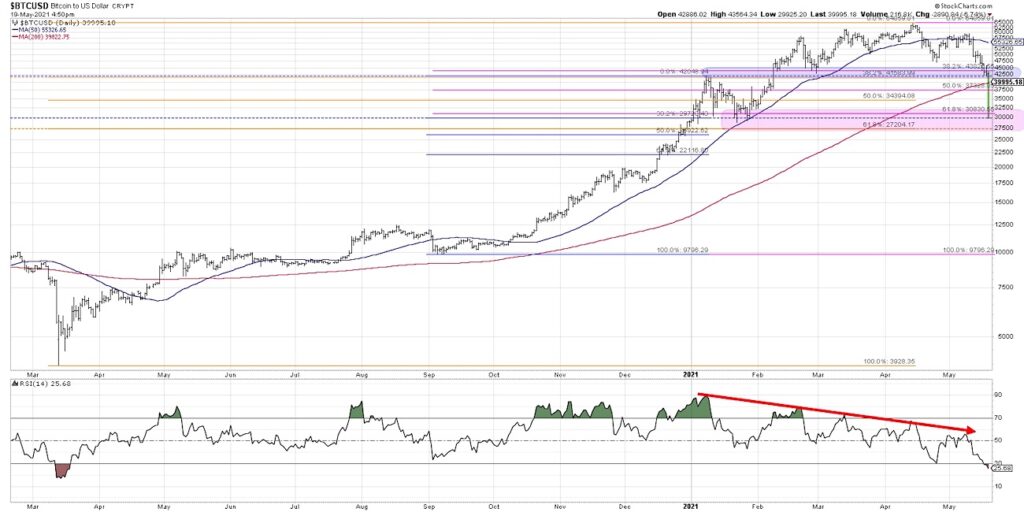
In today’s video, we’ll talk about the downside reversal in Bitcoin within the context of a broader move away from risk assets, and how Fibonacci retracements are an ideal technical approach to make sense of a volatile market environment. We address the following questions about the Bitcoin trading top and crash (see chart below for quick reference):
What were the bearish warning signs for Bitcoin that signaled a rotation from accumulation phase to distribution phase?
Why was 30,000 such a key level for Bitcoin, and what levels could be important going forward?
Have we seen a bottom for cryptocurrencies, and what “line in the sand” would indicate a broader recovery?
For deeper dives into market awareness, investor psychology and routines, check out my YouTube channel!
One Chart: The Bitcoin Crash – Using Fibonacci Retracements
Bitcoin crash price chart
Twitter: @DKellerCMT
The author may have positions in mentioned securities at the time of publication. Any opinions expressed herein are solely those of the author, and do not in any way represent the views or opinions of any other person or entity.


