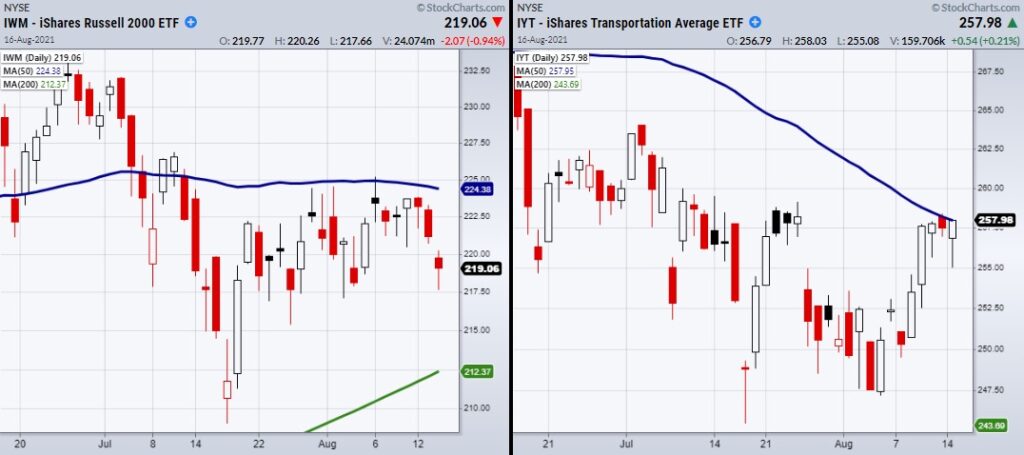
Since mid-May, the Transportation Sector ETF (IYT) has been trending lower. Currently, IYT sits just under price resistance from its 50-day moving average at $257.97.
Additionally, the small-cap index Russell 2000 (IWM) has traded sideways for over a month and continues to have trouble clearing its pivotal $225 resistance level.
Because IWM represents a large section of the economy and IYT can be correlated to the movement of goods within the economy, both are key symbols to watch for market strength or weakness.
I returned from vacation today and pointed out that the NASDAQ has also traded sideways and the Russells lower while the S&P 500 ETF (SPY) and the Dow Industrials ETF (DIA) are a smidge higher. And that is after 3 weeks.
In general, the stock market is still reacting more to the continued hopes of Federal Reserve stimulus along with the ongoing low interest rates.
Utilities and Consumer Staples have soared.
So, if SPY and DIA are so happy, why can’t the Modern Family show us more enthusiasm?
With that said, what other symbols are we watching that could help IYT and IWM clear nearby resistance?
Since the beginning of the pandemic, the Fed has played a major role in supporting the market and economy.
One of their main programs has been the 120-billion monthly bond-buying program.
Therefore, to keep track of how effective the Feds’ spending has been we can look at the High Yield Bond ETF (JNK).
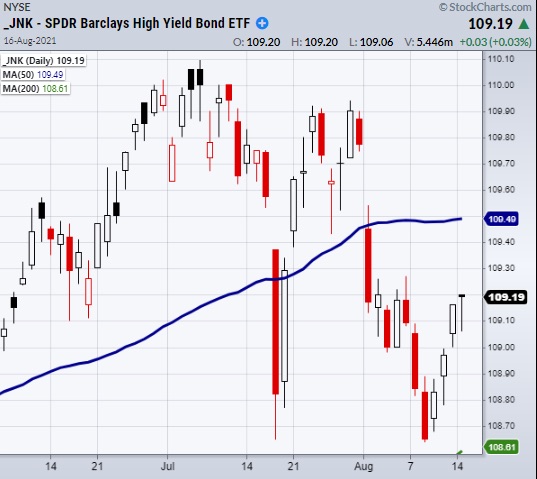
Currently, JNK sits underneath its 50-DMA at $109.49. In order to show that investors are still very bullish, JNK will need to clear back over its 50-DMA.
Therefore, along with watching IWM and IYT to clear nearby resistance, we should watch JNK as it can be used to indicate how well the Feds money is helping prop the market up.
Stock Market ETFs Trading Analysis & Summary:
S&P 500 (SPY) New highs.
Russell 2000 (IWM) Needs to clear resistance at 225.
Dow (DIA) 351 support.
Nasdaq (QQQ) 362 support.
KRE (Regional Banks) Holding over its 50-DMA at 64.99.
SMH (Semiconductors) Next support area 256.94 the 50-DMA.
IYT (Transportation) Watching for 2 daily closes over the 50-DMA at 257.97.
IBB (Biotechnology) Support area the 50-DMA at 164.05
XRT (Retail) 93.51 support. 98 resistance.
Twitter: @marketminute
The author may have a position in mentioned securities at the time of publication. Any opinions expressed herein are solely those of the author and do not represent the views or opinions of any other person or entity.
")


")
