Gold and silver are trading in a relatable way to Dire Straits hit song “So Far Way”.
In that song, Dire Straits wrote, “you’re so far away from me. so far I just can’t see.”
Well, if you’re a trader with a deep understanding of the relationship between Gold and Silver, you know that it’s important to watch how Silver is performing. Especially when Gold is nearing important resistance.
Long story short, Silver strength is bullish for Gold. And right now, silver is showing little-to-no strength.
Note that the following MarketSmith charts are built with Investors Business Daily’s product suite.
I am an Investors Business Daily (IBD) partner and promote the use of their products. The entire platform offers a good mix of tools, education, and technical and fundamental data.
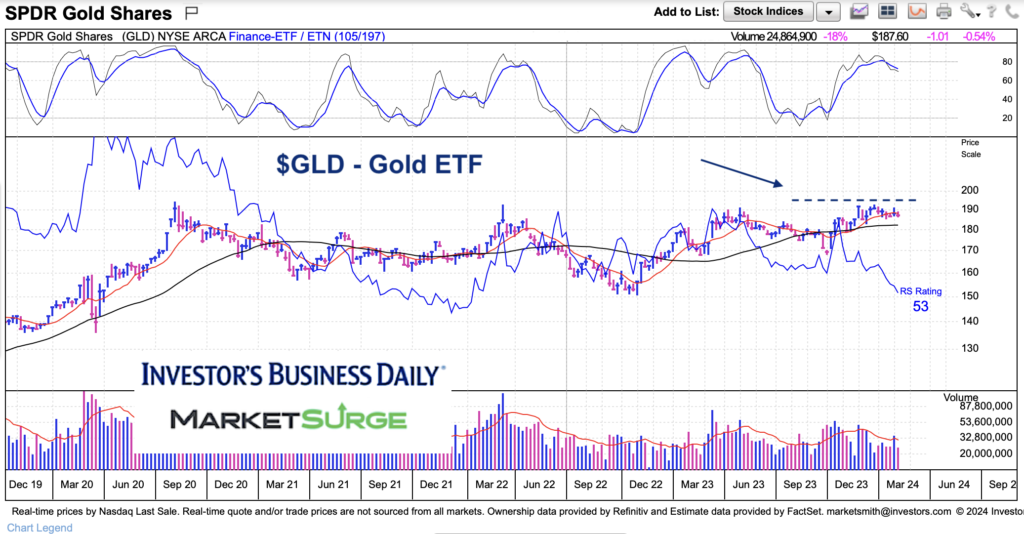
$GLD Gold ETF “weekly” Price Chart
Here’s the Gold ETF. As you can see, GLD is trading fairly close to the $190 to $195 resistance band. Bulls are watching for a breakout. But perhaps bulls should also be watching Silver.
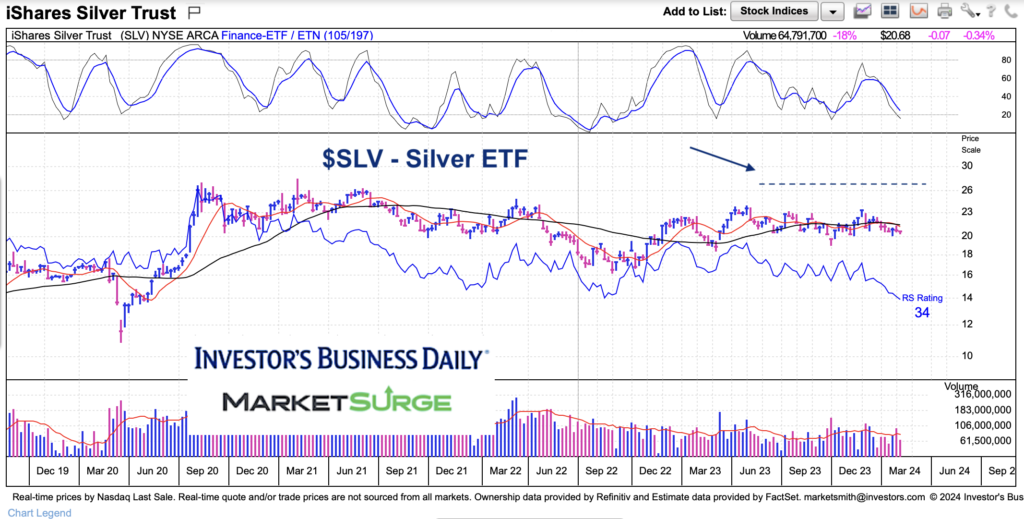
$SLV Silver ETF “weekly” Price Chart
Silver is trading well below its resistance around the $27 level. Gold does better when Silver is leading. So precious metals bulls still have work to do. Stay tuned!
Twitter: @andrewnyquist
The author may have a position in mentioned securities at the time of publication. Any opinions expressed herein are solely those of the author, and do not in any way represent the views or opinions of any other person or entity.
")

 Testing Important Price Support")
")
