We’ve all been there before.
A stock we own is trending higher, moving from lower left to upper right on trading screens.
And all the sudden, it drops 10 or 15 percent. Maybe it’s a poor earnings report, reduced guidance, or bad news, but all we know is our once beloved stock just gave back several week’s of gains.
That’s what we call a “reversal”. Or in many cases, a reversal of fortune. In today’s post, I will share a few insights about reversals and spotting them with candlesticks. The chart today is for illustrative purposes. I do not own any shares of Sleep Number Corp (SNBR).
Note that the following MarketSmith charts are built with Investors Business Daily’s product suite.
I am an Investors Business Daily (IBD) partner and promote the use of their products. The entire platform offers a good mix of technical and fundamental data and education.
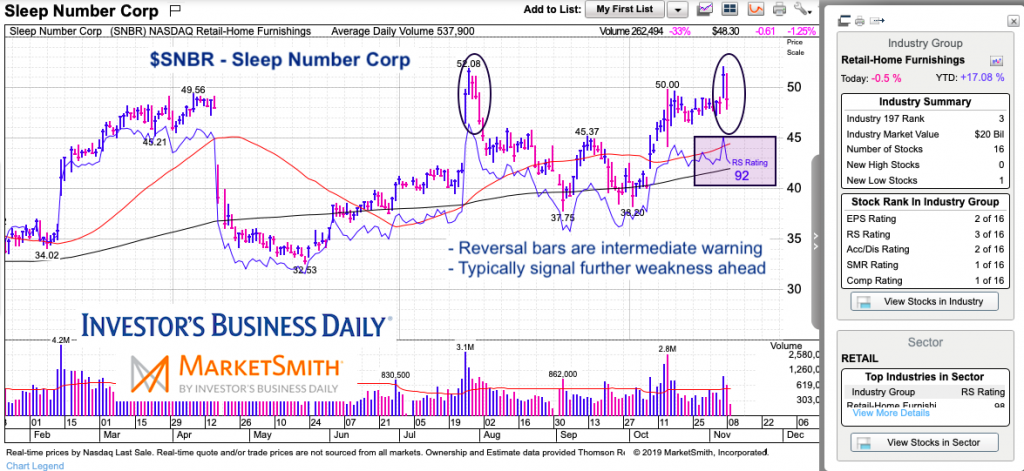
Chart Illustration with Stock Price “Reversals“
I chose this chart because it highlights 3 price reversal spots, 2 of which occurred intraday and formed candlestick warnings (reversals).
The 1st one occurred back in April. Simply a big gap lower to open a session. These occur overnight on bad news such as earnings. This may be a moment to take a little off of your position and wait to buy it back at lower prices. It can also be used as a buying opportunity if you like the company and do not have a full position. I typically stick with the three day rule – I won’t buy a stock until the 3rd day after bad news (and keep size small).
The 2nd and 3rd price reversals on the chart are circled. These are important for similar reasons to the 1st one. However, the reversal lower occurred intra-day (remember, this is a daily chart) and it wasn’t an immediate 25 percent loss. When price reverses course within the time period of the candles (in this case daily), it produces a red bar. And if it is a 5 percent move or more, the bar will tend to be longer. These are warning signs.
After the July reversal (first circle), price continued lower for 3 more days. It then attempted to consolidate before moving lower again… and again. The November reversal looks similar. Will it produce another multi-week move lower? I have no idea. But I do know that we can spot these with candles on daily and weekly (an intra-week reversal) charts. And we can take some action to lighten up on our positioning. Again, this chart is just for illustration and I do not own any shares in SNBR.
Twitter: @andrewnyquist
The author may have a position in mentioned securities at the time of publication. Any opinions expressed herein are solely those of the author, and do not in any way represent the views or opinions of any other person or entity.


: Showing Some Signs of Emerging Strength")
