As the Thanksgiving holiday shopping weekend is here, we will look at the SPDR Retail Sector ETF (XRT).
Investors and retailers are also closely monitoring consumption over the holiday weekend.
The National Retail Federation estimates that 166.3 million Americans will shop through Cyber Monday, up by 8 million people from last year.
Consumers are saving less and charging more – but still spending.
Despite inflation, many retailers expect sizable profits this weekend as consumers look for great bargains and appear willing to spend money.
So, what does this holiday weekend indicate for the retail sector’s health?
While some retail stores are struggling, others are seeing increased sales, which is evident by looking at the volatile price swings of XRT.
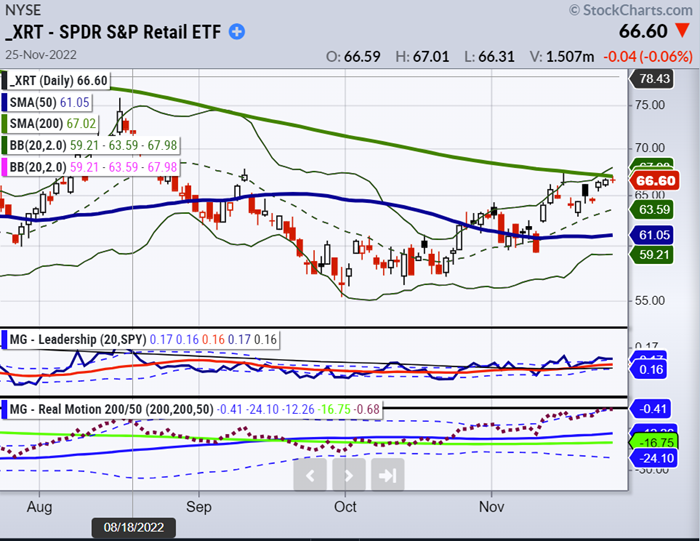
Since October, XRT has struggled and regained its 50-day moving average decisively in November. XRT is now on the verge of its 200-day moving average and may cross it.
Our proprietary Real Motion indicator displays price momentum in line with the upward trajectory of the Bollinger Bands – indicating continued higher prices.
Our Leadership/Triple Play Indicator also exhibits strong leadership performance relative to the S&P 500 (represented by SPY above), indicating continued outperformance.
Looking at multiple timeframes helps to validate and confirm signals.
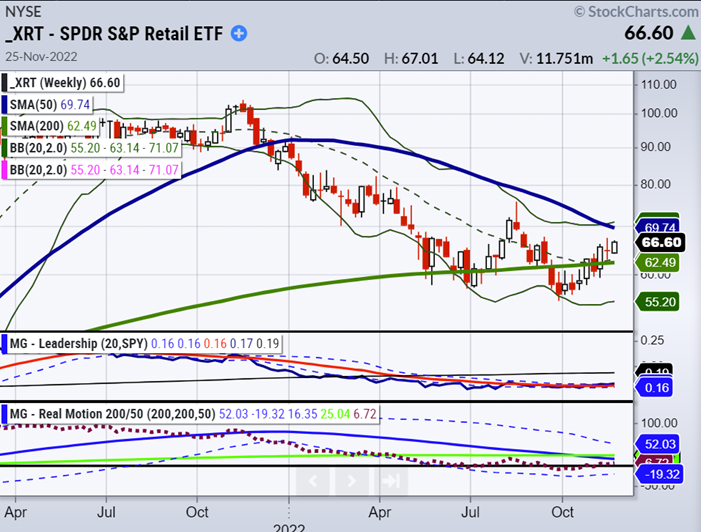
Looking at the weekly chart, XRT recently regained the 200-week moving average, recovering from a weekly low of 55.20 on September 30 and closing today, November 25, at 66.60.
The 50-week moving average at 70 serves as solid overhead resistance.
The Real Motion Indicator is above the zero line and indicates that Granny’s price should continue trending higher towards resistance.
Our Leadership/Triple Play Indicator also exhibits recovering leadership compared to the SPY.
We employ proprietary trading indicators, including phases, momentum, trend strength, and price leadership – to signal price changes.
Although the retail sector faces headwinds, XRT provides exposure to consumer staples and consumer discretionary stocks, and XRT’s price has solid momentum and price leadership underpinning it.
The Real Motion Indicator and Leadership/Triple Play Indicator signal that the Retail Sector’s price should continue trending higher until solid overhead resistance.
Stock Market ETFs Trading Analysis & Summary”
S&P 500 (SPY) 400 support and 404 resistance
Russell 2000 (IWM) 182 support and 188 resistance
Dow (DIA) 340 support and 346 resistance
Nasdaq (QQQ) 284 support and 288 resistance
KRE (Regional Banks) 62 support and 66 resistance
SMH (Semiconductors) 218 support and 225 resistance
IYT (Transportation) 225 support and 231 resistance
IBB (Biotechnology) 130 support and 137 resistance
XRT (Retail) 64 support and 68 resistance
This article was contributed to by Keith Schneider and Wade Dawson.
Twitter: @marketminute
The author may have a position in mentioned securities at the time of publication. Any opinions expressed herein are solely those of the author and do not represent the views or opinions of any other person or entity.

: Worrisome to Broader Market?")

