Election day is here and the stakes are high. Uncertain investors will remove a bit of uncertainty after a winner is announced. Today, I want to provide an update on key stock market indicators and trends, as well as a look at what history says about presidential cycles and winners.
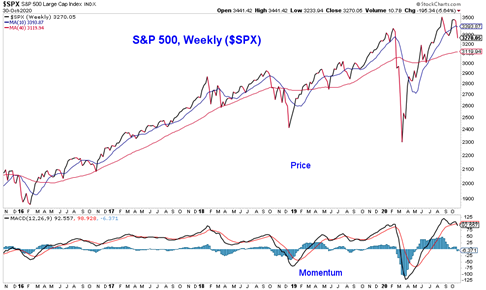
The weekly chart of the S&P 500 Index shows both the 10-week and 40-week averages rolling over for the first time since Q1 last week and both price and momentum made lower lows (after making lower highs in September). This is evidence of a weakening trend, and should this persist, it could call into question the health of the cyclical rally off of the Q1 lows for the S&P 500.
I continue to believe this is a good time to look beyond this index (toward small/mid caps and overseas markets) for leadership going forward. I will provide an update on this theme in an article later this week, assuming we avoid an election catastrophe.
This week’s election is on everyone’s mind, but it is not the only thing that matters to the market. In fact, it may not even be the most important thing (being loud doesn’t necessarily make you relevant, it might just make you noisy).
At this point, we’ve all seen enough election-related videos, one-pagers & in depth perspectives to know that everything worth saying about the election has probably already been said, probably at least several times.
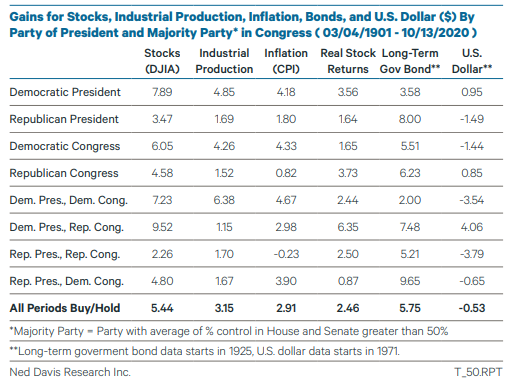
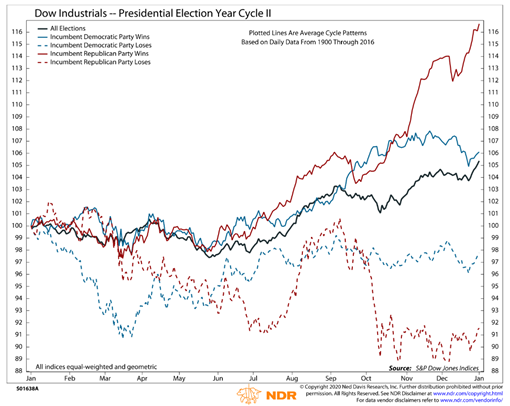
Given that, I’ll just share two images (both from Ned Davis Research). The first is a summary of how the stock market and economy have performed under various political regimes in the past. The second shows the near-term path stocks have followed in the wake of Republican incumbent victories versus defeats.
History suggests a larger near-term bounce if Trump wins re-election on Tuesday. Viewed from the context of an entire term, the political preference of the market and economy is less clear. For this year, uncertainty about the outcome seems to be a larger risk to the market than either candidate clearly prevailing.
The Fed remains a bullish tailwind for stocks and the economy (even after a gangbusters Q3 GDP report) remains neutral. The distribution of outcomes in the economy is increasingly bi-modal – there are many doing well right now and also many who are really struggling. Summary statistics don’t do a great job of capturing reality in such situations.
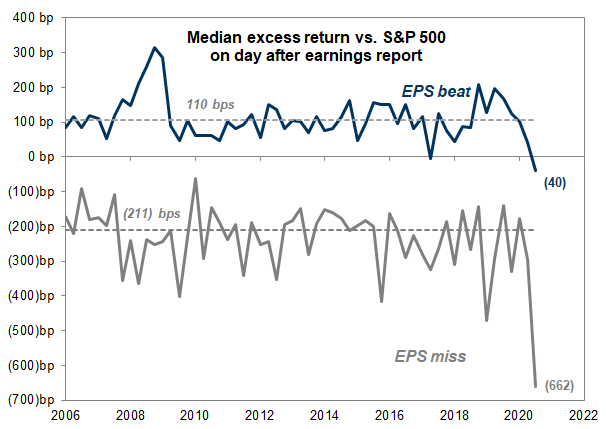
Valuations (which are off their peak but remain elevated) are a headwind. As earnings season moves along and the overall beat rate runs in the mid-80’s, this chart from Goldman Sachs is eye-opening. Companies reporting an earnings beat have been sold this quarter, while those reporting an earnings miss have been demolished. Perhaps the earnings bar was higher than officially recognized – and it is rising as we head into 2021.
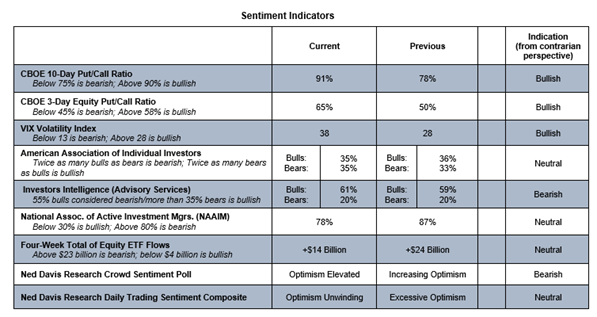
Options data showed some evidence of fear entering the market last week, but survey data has yet to show the sort of meaningful unwind in optimism that would support a more constructive view on investor sentiment.
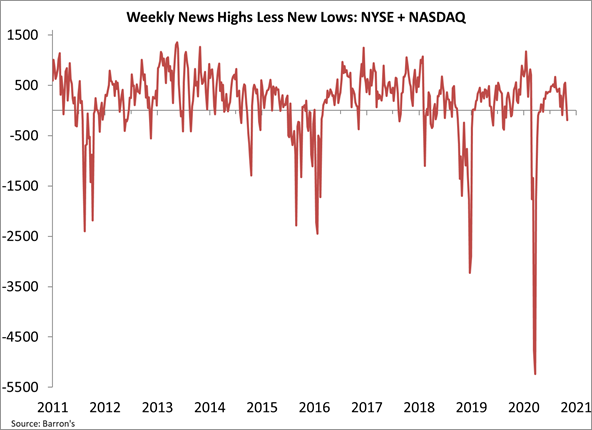
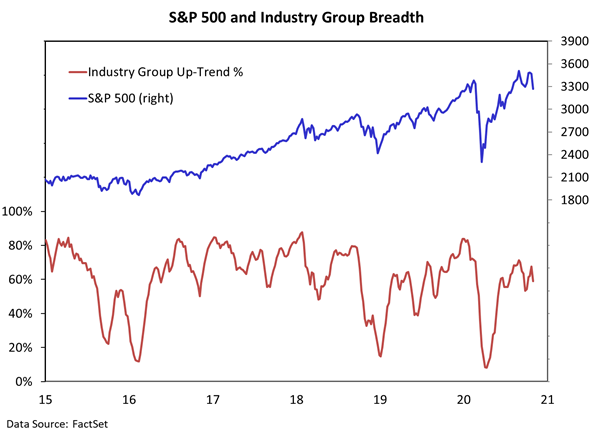
Last week’s selling did more to damage breadth than it did to relieve optimism. That is not a constructive development if the pre-election weakness is just a re-test of the September lows. I am not downgrading breadth at this point, but it definitely bears watching. A lack of resiliency from the broad market would make a year-end rally more of a challenge (and lead to new questions about the health of the secular trend). News lows are expanding, only 6% of world markets are trading above their 50-day averages (this did not get lower than 12% in September), and our industry group trend indicator has rolled over (watch for a lower low, as that would be a meaningful deterioration).
The Bottom Line: If last week was a re-test, lows should hold and rally attempts should be accompanied by sharply improving breadth (including multiple 9:1 up days). Election-related noise will eventually diminish, but may get louder before it does so.
Twitter: @WillieDelwiche
Any opinions expressed herein are solely those of the author, and do not in any way represent the views or opinions of any other person or entity.


 Flirting With Critical Support… Again")


