The S&P 500 declined -5.07% for the month of January, the 8th worst performing January since 1950. The index gapped down to open the month on January 4th and it never recovered. At the low of the month (1,812.29) the index was down -11.33%, the second largest drawdown in January’s history next to January 2008’s drawdown of -13.51%.
If you were looking forward to a big year of stock market returns in 2016, this wasn’t a great way to kick off the year.
The S&P 500 didn’t spend one tick in positive territory for the month as the index never once traded over December’s close at 2,043.94. This marks the first January in 59 years, and just to third since 1950, to not spend even one second during the month trading in positive territory. It was a route for the Bears, the Bulls never had the lead.
S&P 500 Update: Navigating Uncertain Certainty
While the Bulls never had the lead, they did mount a comeback. The S&P 500 closed the month with a 7.06% rally from its monthly low over the final 8 trading sessions. This oversold bounce furthers the “déjà vu” from January 2008 as seven years ago the S&P 500 closed 8.54% off its monthly low via a strong month end rally the final 7 trading sessions of the month.
A calendar month that declines as much as -11.33%, finishes with a rally of 7.06%, and still closes the books down -5.07%, leaves pillars of hope for both the Bulls and the Bears to stand on as far as potential stock market returns in 2016.
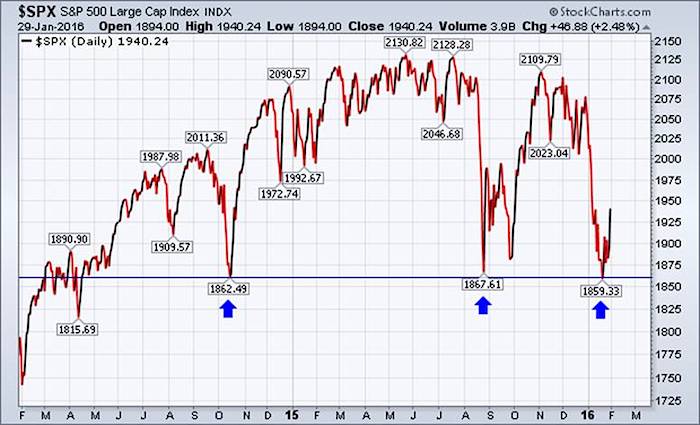
On the bullish side of the equation, it appears the S&P 500 has held critical support on its daily, weekly, and monthly charts. The daily chart found support exactly where it needed to. Every participant alive marked 1,862.49 and 1,867.61 as critical support when the index was in free-fall in January. And what do you know, support held.
The weekly chart also found support exactly where it needed to…

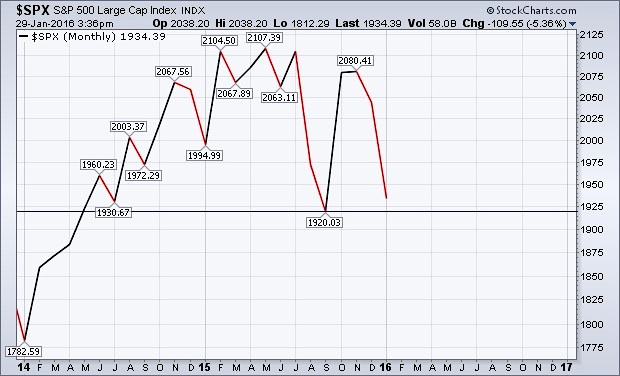
And lastly, the Bank of Japan may have offered the market a “stick save and a beauty” as Friday’s upside explosion left the monthly chart finding support exactly where it needed to, closing above 2015’s closing low at 1,920.03 and summer 2014’s closing low of 1,930.67.
At the moment, one could argue it’s impossible to label the primary trend either up or down with any conviction.
Participants remain centered on buying the dips and selling the rips. The S&P 500 remains confined between critical levels of both support and resistance, essentially stuck in neutral and going nowhere fast. And this makes “predicting” stock market returns in 2016 difficult.
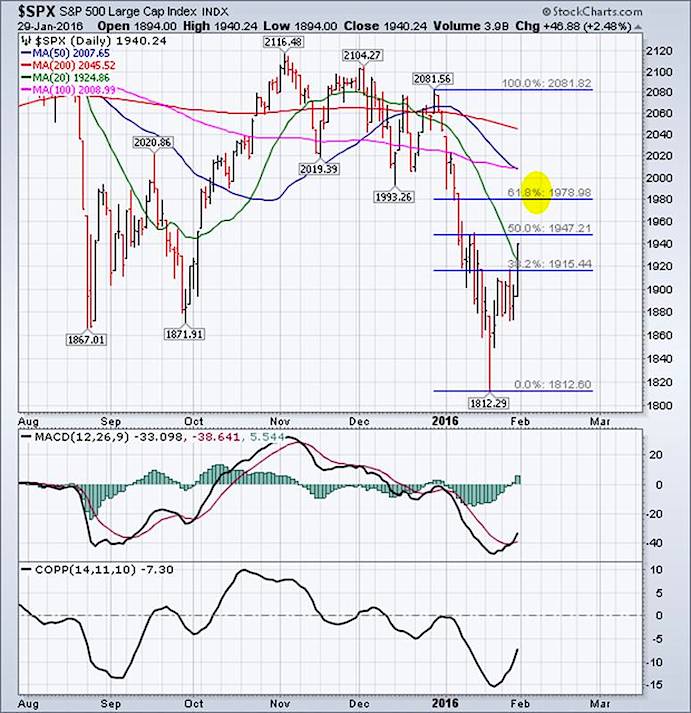
From a momentum perspective, we’ve now triggered a daily “buy” signal on the MACD and the Coppock Curve has room to run to the upside. The Fibonacci 50% and 61.8% retracements lie between 1,947 and 1,978 while potential moving average resistance sits between 2,007 and 2,045. Since 1950, the average February drawup relative to January’s close is 2.68%. This would target a potential February high at ~1,991 and would likely coincide with price meeting a confluence of resistance. It would be reasonable to see the index trade toward and slightly beyond the 2,000 mark in February. This would undoubtedly revive the Bulls animal spirits, place a dent in bearish market sentiment, and greatly increase the conviction that the bottom’s in for stocks and the worst is behind us.
But, this is exactly how bear market rallies work.
The bearish side of the equation is stacked with evidence that suggests not only that February may be a difficult month, but that 2016 may also be a difficult year. First, you may have heard the saying “so goes January, so goes the year”.
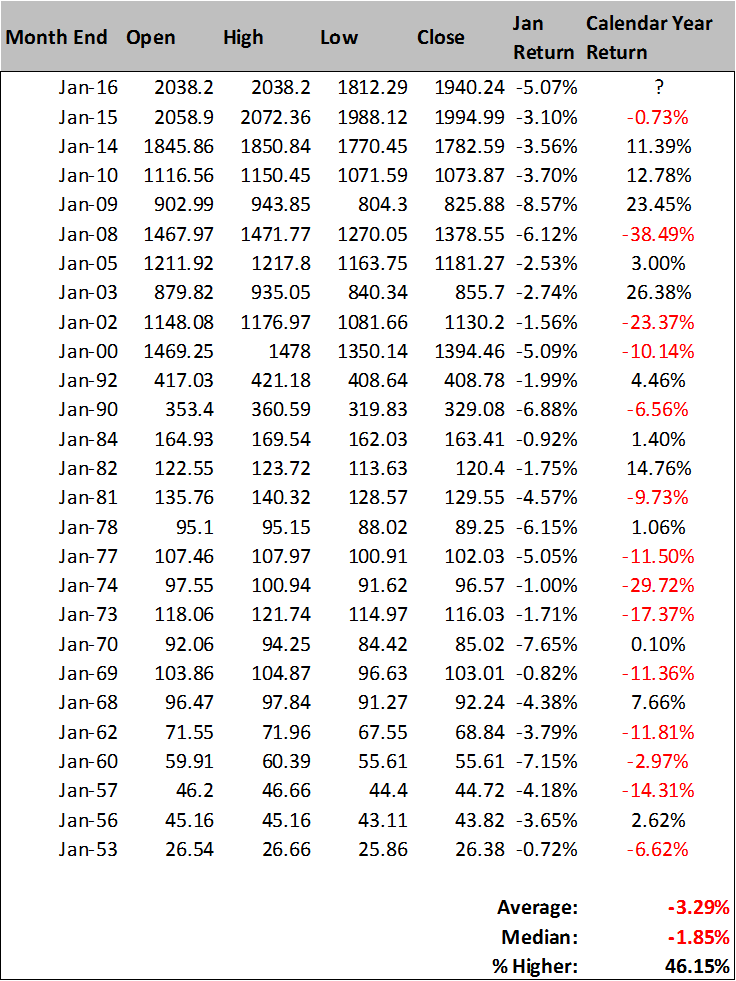
January of 2016 marks the 27th negative January for the S&P 500 since 1950. The index’s average annual return in the prior 26 instances is -3.29% and it’s higher just 46% of the time. That doesn’t bode well for stock market returns in 2016.
Now let’s look at data and returns looking at scenarios with negative three month returns.
continue reading on the next page…


: Showing Some Signs of Emerging Strength")
