This article was contributed to by Keith Schneider and Wade Dawson
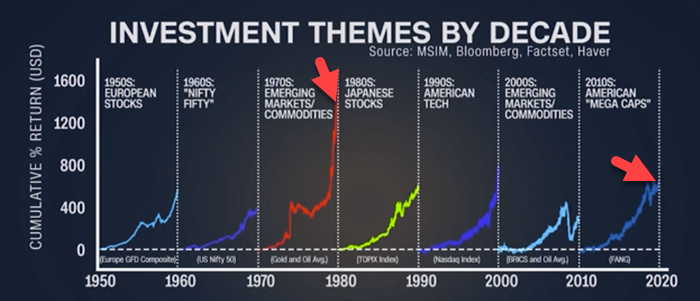
The Big View: Key Investment Themes by Decade 1950-2022. During the 1970s commodities and emerging markets led with cumulative 1,500% USD returns.
Market leaders are constantly evolving and staying up to date on the newest trends and macro events can be challenging.
Looking back at previous decades of market leadership provides insight into how market leaders change over time, and the impressive cumulative returns indicate potential future market leadership gains.
It may seem grim this week as tech stocks like Apple, TSLA, Meta, and other mega-cap names continue to fall, but history reminds us that new leaders are potentially emerging.
Traders should stay attuned to shifting current market conditions to look for new leadership trends. It helps to have trading indicators and research tools to pinpoint changing market leadership.
So, what does all this mean for investment themes in 2023?
To stay on top of shifting market leadership, it is essential to be aware of the key factors that signal changing leadership.
Our Triple Play Indicator can help signal and alert traders where and when capital should be deployed based on market leadership.
The last decade had a fantastic run for large-cap growth stocks, and the FAANGs dominated until the beginning of 2022.
Given the crypto winter and current crypto FTX crisis, a shifting macro backdrop might usher in fresh leadership, similar to commodities emerging in the 1970s with precious metals gaining astronomical returns.
It is also consistent with our view that we are in a comparable inflationary environment as the 1970s.
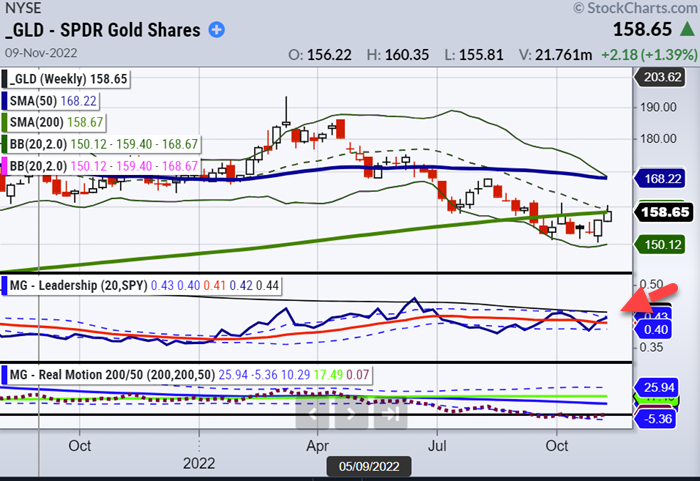
Real assets, particularly gold, exemplify potential new leadership emerging. The Triple Play indicator measures price leadership and volume strength, and gold outperforms the SPY ETF above.
When the Triple Play blue line is above the red line, it’s bullish. It highlights that gold will likely continue to rally while its trend is strengthening.
The indicators and data provided by our Triple Play Indicator can help you stay ahead of shifting market leadership so you can adjust your trades accordingly.
Mish in the Media:
CMC Markets 11-09-22What’s next for key sectors after US midterms?
Business First AM 11-08-22Why We Love the Metals
Stock Market ETFs Trading Analysis & Summary:
S&P 500 (SPY) 369 support and 377 resistance
Russell 2000 (IWM) 171 support and 177 resistance
Dow (DIA) 321 support and 329 resistance
Nasdaq (QQQ) 260 support and 265 resistance
KRE (Regional Banks) 60 support and 65 resistance; same as before
SMH (Semiconductors) 189 support and 197 resistance
IYT (Transportation) 208 support and 214 resistance
IBB (Biotechnology) 127 support and 132 first resistance; same as before; closed at 129.05
XRT (Retail) 58 support and 63 resistance; same as before; closed at 59.41
Twitter: @marketminute
The author may have a position in mentioned securities at the time of publication. Any opinions expressed herein are solely those of the author and do not represent the views or opinions of any other person or entity.

: Worrisome to Broader Market?")


