Nearly every member of Mish’s Modern Family improved last week, with the Russell 2000 IWM, Transportation IYT, Semiconductors SMH Retail XRT all putting in Golden Crosses on their daily charts.
Except for Regional Banks KRE.
Risk off or on during this data heavy week?
Clearly the performance of MarketGauge’s Trend Strength Indicator (TSI) improving across all 4 key indices, with Small Caps (IWM) and the Dow (DIA) leading the bunch points to risk on.
Risk off
However, some areas should keep investors on their toes.
The 52-week New High / New Low ratio for the Nasdaq Composite has actually begun to deteriorate, a clear Risk-Off indication for the short term.
And, despite the improvement in the market, the Yield Curve has actually continued to invert further.
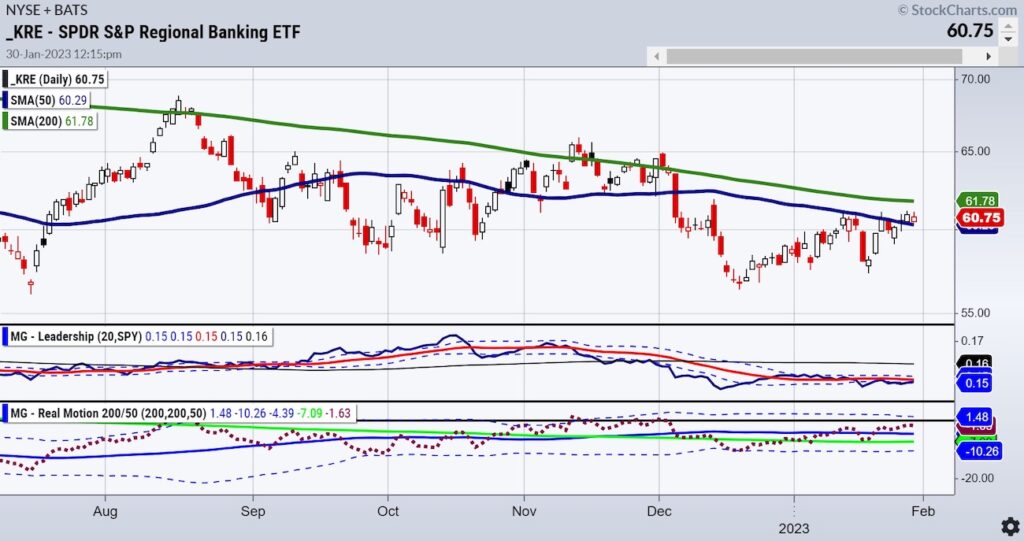
Regional Banks KRE have not had a golden cross (the 50 daily moving average clears above the 200-DMA).
KRE sits atop the 50-DMA, true. Nonetheless, looking out a wee bit at the weekly chart, KRE has yet to clear resistance and way underperforms the rest of the family.
We have seen this before.
KRE’s momentum according to our Real Motion Indicator shows a bullish cross from last November. Yet the price has done nothing but decline in momentum since the since then.
Another member of the Economic Modern Family, Transportation is also flashing a warning on the weekly chart.
Note that IYT has failed to clear the 50-week moving average (blue line).
Also note the slope on the 50-WMA is negative.
IYT is beginning to underperform the SPY and momentum according to Real Motion is slipping lower. Also interesting to observe is that the momentum moving averages had a death cross in early November.
Transportation and Regional Banks make up nearly 1/3 of the Economic Modern Family.
Of course, the week is young, so we have time to see if both sectors play catch up or are sending us a meaningful warning message.
Either way, they are not to be ignored.
Stock Market ETFs Trading Analysis & Summary:
S&P 500 (SPY) Resistance met and price retreated 390-400 to hold.
Russell 2000 (IWM) More worrisome as we had a glass ceiling high. Could mean a visit to 177 if cant clear Fri highs.
Dow Jones Industrials (DIA) Gentler correction which has bode well for the industrials since December.
Nasdaq (QQQ) Like IWM a glass ceiling high. 280 not crazy to see.
Regional banks (KRE) Keep watching to see if holds 60 then 57.
Semiconductors (SMH) Like IWM QQQ could see a 5-10% decline from here.
Transportation (IYT) Most obvious failure of the 50 week MA.
Biotechnology (IBB) Multiple timeframes count and this failed the 23 month MA so far.
Retail (XRT) This sector held up better-if Granny’s brethren fall tho, XRT can make its way back to 64.
Twitter: @marketminute
The author may have a position in mentioned securities at the time of publication. Any opinions expressed herein are solely those of the author and do not represent the views or opinions of any other person or entity.


