This is a great time to examine the weekly charts of the Economic Modern Family.
We like that timeframe for now with only a short number of trading days left.
And with lots of news constantly unfolding:
- Rate cuts/no rate cuts
- Middle East heating up with shipping routes in danger
- Soft landing/no soft landing
- Inflation cooling-according to the cooked up numbers
- Consumer sentiment high
So, off to the charts we go.
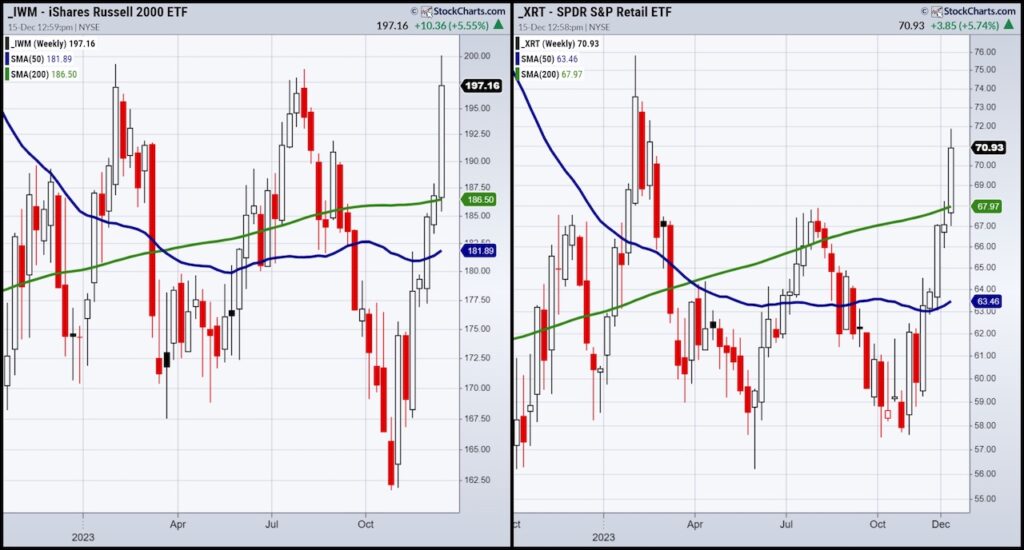
Our Granddad Russell 2000 IWM, the 2022 high is not even close at 227.13.
The 2023 high at 199.26 was taken out this week. Plus, it closed under that level, making a double or actually triple top a possibility.
How would we know? IWM fails 194.
Of course, a move over 200 will be a reason to love Santa even more.
Granny Retail XRT has moved well, but comparatively, still below its 2023 high at 75.77.
So, Granny helps, but needs to do more. And, under 68.00 could be considered a breakdown.
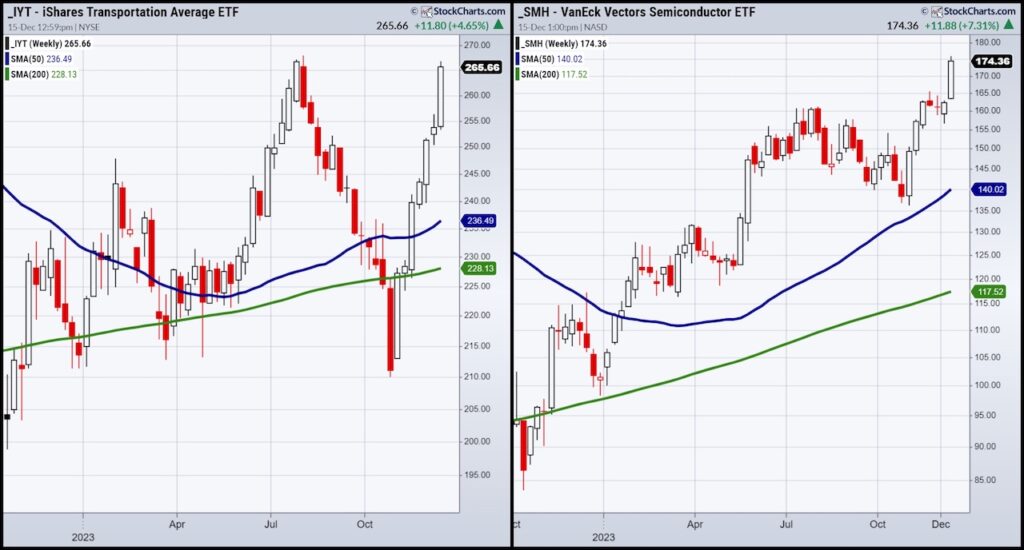
Transportation IYT is also at resistance near its 2023 high of 267.85.
For reference, its all time high is 282.40 made in 2021.
As long as this holds 257, we will remain optimistic.
And that covers the “inside sectors” of the US economy.
Strong but frothy and into major resistance.
No doubt the US economy outperforms globally.
Emerging Markets
Two weeks ago, we featured the ratio between SPY and Emerging Markets at 50-year lows.
Clearly, EEM has rallied. And as we wrote December 1st, “Should EEM clear the 23-month MA that is a start.
The risk would be clear, under the low of the month EEM close over the 23-month MA.
Then, we would look to see if EEM can clear what appears to be the scene of the breakdown crime or at 42-43.00.”
That has happened FYI.
Now, back to our next member of the Family-our Wonder Woman Sister Semiconductors SMH.
SMH made new all-time highs handily.
The move over 160 (which was the number we kept writing had to hold) measures to around 240.
Can she do it?
The only thing that would stop her is if by the end of December, SMH cannot close over 174.
That would be a key failure of the monthly chart using Bolinger Bands.
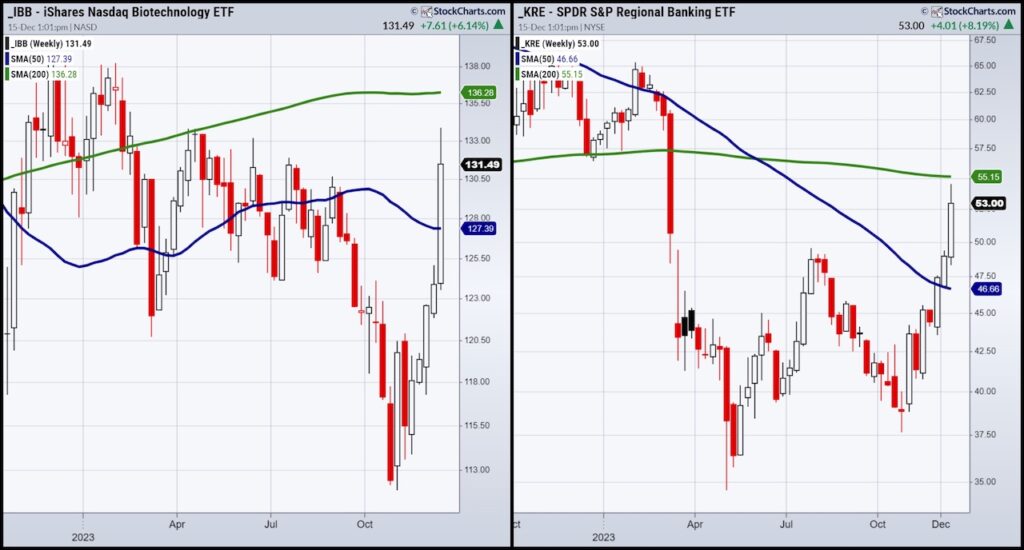
Brother Biotechnology IBB proves why weekly charts and stepping back should be part of any trader’s analysis.
This week IBB cleared 120 (as we wrote about as well as a key point), and the 50-week moving average.
However, IBB has the 200-WMA looming. And it remains an underperformer.
But IBB cleared the 23-month for the first time since 2021. That’s good.
So, we watch to see if IBB holds 125 by the end of December.
Lastly, Regional Banks KRE our Prodigal Son, everyone’s favorite son.
On the monthly chart not shown, it is right up to resistance at the 23-month MA.
On the weekly chart, KRE is at major resistance at the 200-WMA.
While this move has wiped out a lot of the losses after the March crash, KRE needs more work to really join the party.
Moreover, we are watching KRE to hold 48-49 before we get worried about another down move.
And talk about Santa, look out for the Outlook 2024 to be released this week!
Twitter: @marketminute
The author may have a position in mentioned securities at the time of publication. Any opinions expressed herein are solely those of the author and do not represent the views or opinions of any other person or entity.
")

 Testing Important Price Support")
")
