Back in front of the screens after two weeks of golf-filled fun, and I find:
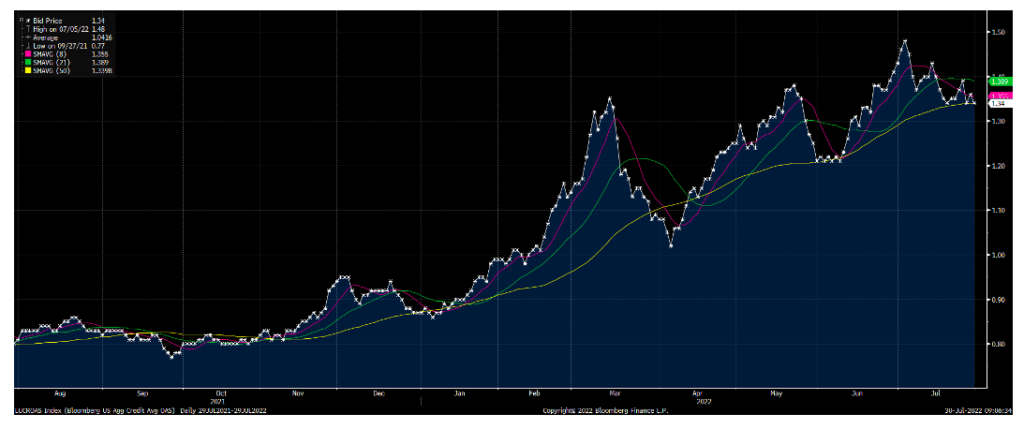
IG cash spreads back to benign levels (134bps) after tickling the danger zone at 150bps
Note that this was written on Monday…
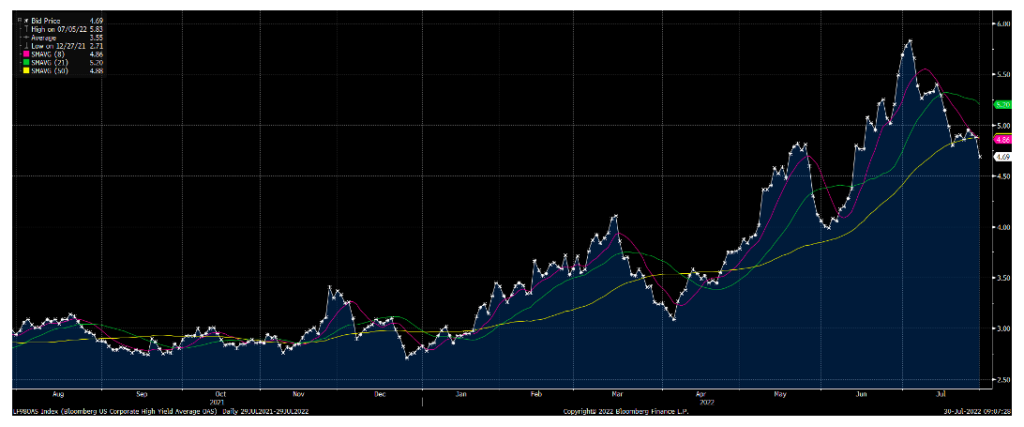
High yield cash spreads with an eye-popping rally, from near 575bps (Danger! Danger!) to below the 500bps threshold.
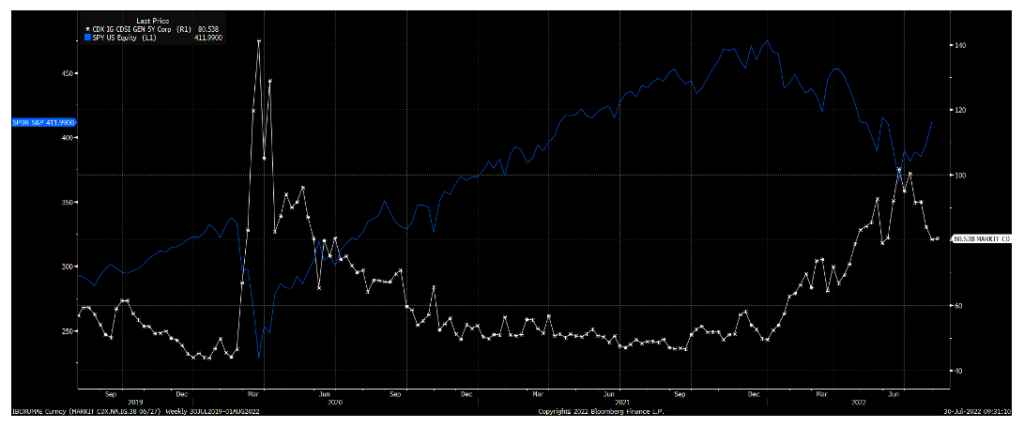
Best in show has been the IG CDX. As I suspected here https://twitter.com/FZucchi/status/1545435423312211968 , the break below 90bps drove stocks to where the battle between the continuation/end of the bear market is going to be fought.
But not all is rosy out there. The 2-10 yield curve continues to get more inverted nearly every day, and at -30bps, it has not seen these levels in 20+ years. At risk of sounding like a broken record, inversions involving funding terms (6-month to 2-years) do not necessarily forecast or cause recessions, but over a long enough period the inversions cause a shut-down of leverage to credit funds which, in turn, creates serious obstacles to the sales of new bonds and the breadth of risk spreads. When that vicious cycle kicks-in, the risk of a credit crisis rises significantly, and we all know how that movie ends.
So, deja-vu all over again? This bear market has been different from any since the mid-90’s because it has not been led by credit. But that does not mean that an accident in corporate bond-land won’t result in more pain for stocks. The trick – and not an easy one – is to look-out for the skid-marks preceding the wreck. So far there aren’t many, but it is worth noting that the two-month aggregate issuance of corporates in June and July was among the lowest in the last 9 years for a 2-month period. (I’m excluding the November- December months because seasonally December is a “dead” month for new bond sales).
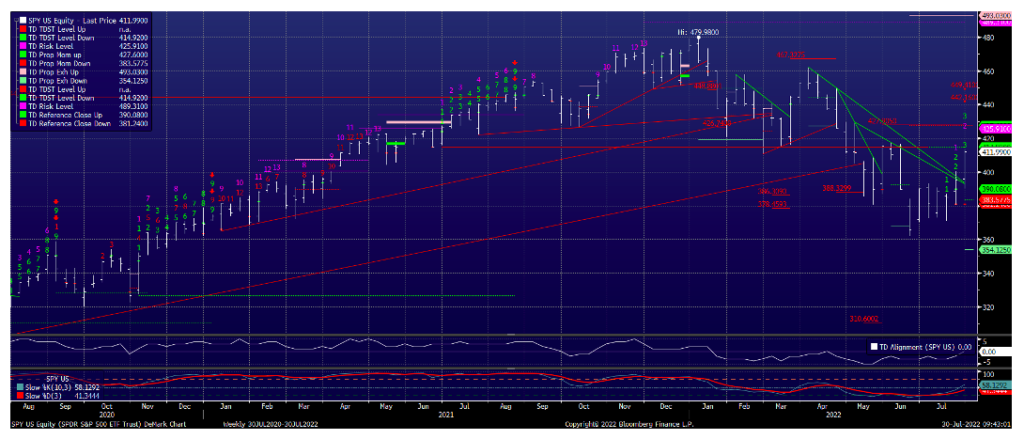
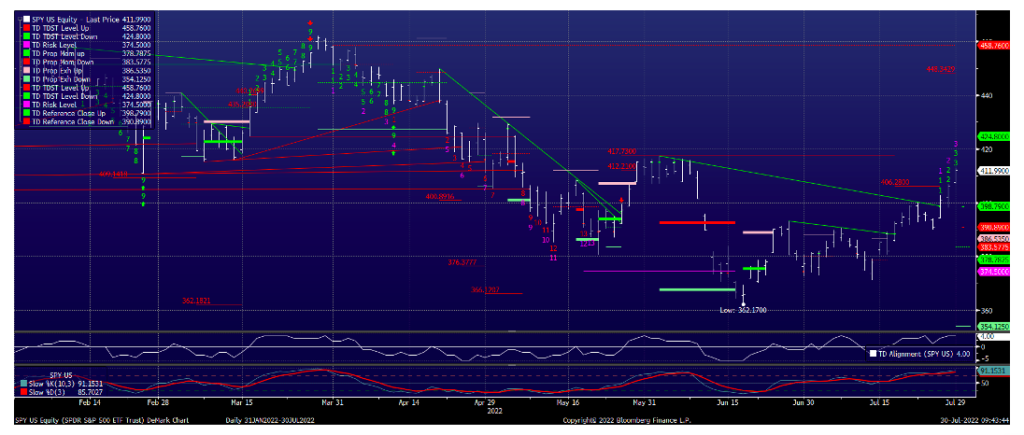
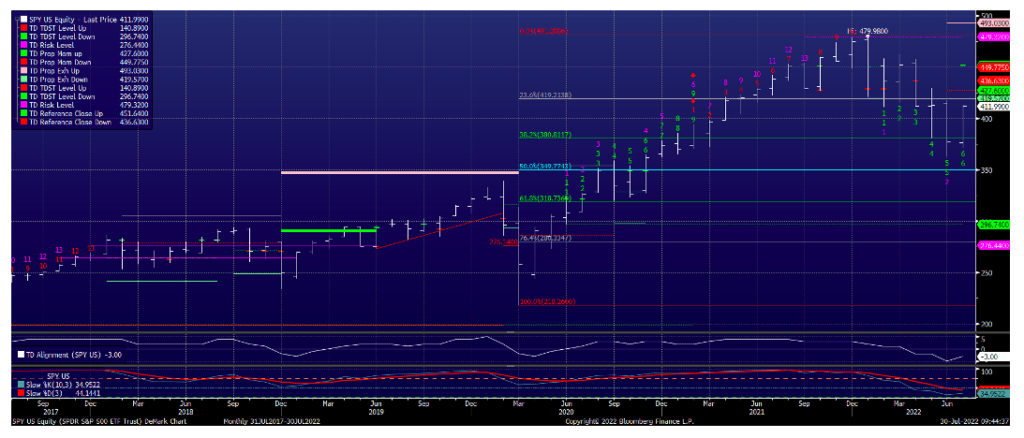
To sum things up, stocks are at critical levels. The $SPY daily and weekly DeMark charts below are encouraging, while the monthly chart spells more downside. Since stocks have led credit in this bear market, the outcome of the battle between equity bulls and bears, will likely have a spillover effect in credit, with all the dynamics and consequences I spelled out above.
Let’s be careful out there.
For daily commentary on credit and stocks you can follow me on Twitter (see handle below).
Twitter: @FZucchi
The author may have positions in mentioned securities at the time of publication. Any opinions expressed herein are solely those of the author, and do not in any way represent the views or opinions of any other person or entity.


