It’s been a crazy past week and half! I’m pretty sure that many who were either unprepared or not disciplined got hurt last week (and potentially early this week if short). The reading below is an adaptation of my weekly stock market update put out earlier this week.
Even as the stock market enjoys a nice rally here, it should be noted that the market has been trendless for a while now so investors still need to be careful out there.
No surprises whatosever from the Federal Reserve last week. As telegraphed, they hiked rates by 25 bps. The stock market rallied at first but then gave everything back and more in the next two days to end the week blood red. But this has given life to the early week rally we are seeing. In other asset classes, we see a strong dollar crushing commodities including Crude Oil that is still hanging near 2008 lows (but oversold). Keep an eye on high yield bonds (ETFs: HYG and JNK) – they have a heavy correlation to commodity prices (as well as equities).
Don’t get me wrong, I am not saying we are headed into another bear market, but there are reasons to be concerned from a market breadth and “macro” level. That said, we’re still in a Bull Market until proven otherwise. We’ll cover this in another stock market update.
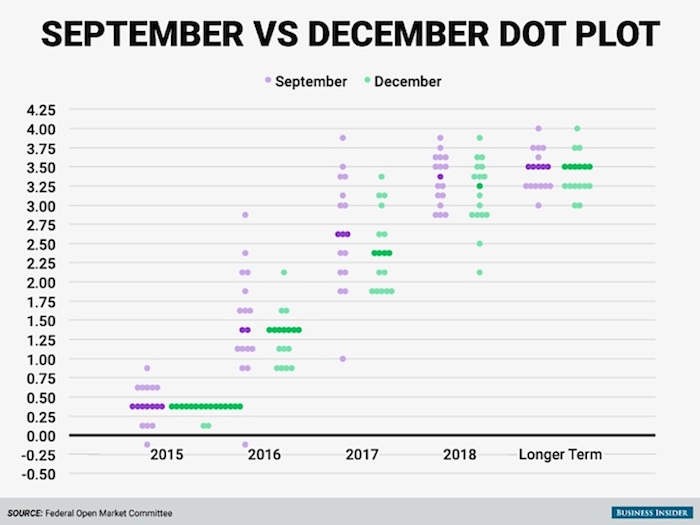
The Fed’s September vs. December Dot Plot shows more pessimism on the economy for the next 2 years. In fact, Federal Reserve officials are pessimistic. If the Federal Reserve cannot raise rates 4 to 5 times or in other words can’t get rates towards 1.5% as depicted below, it purely just says the market was in total disagreement with the Fed.
Before I delve into the market breadth indicators, which aren’t overly rosy, I’d like to use this stock market update to share some positives for this week and possibly next (several charts and data points below courtesy of @RyanDetrick). These are just good to know and something that can pan out but need not.
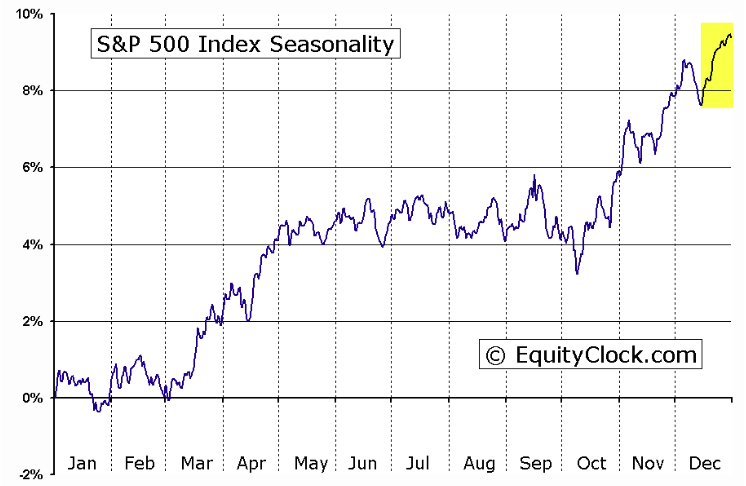
1. Strong Seasonal Aspect for the S&P 500: The last 2 weeks of December are seasonally very bullish, Santa Rally or not. Via EquityClock.com:
2. Buying the close on December 18th and holding for 10 days is one of the best 10 day returns of the year for the S&P 500 (SPY).
3. December 26th is one of the best days of the year. December 16th was also a historically strong day.
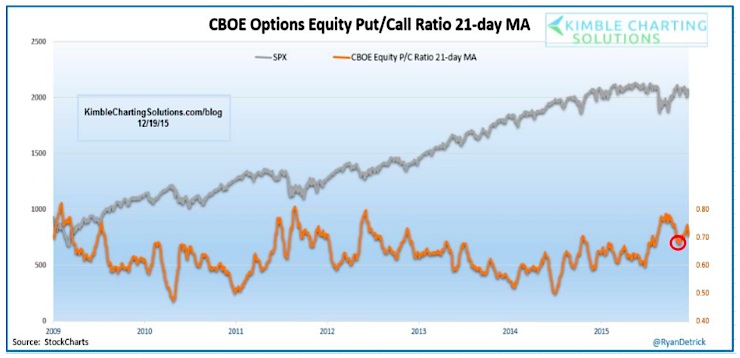
4. $CPCE – The 21 MA for the CBOE Equity Only Put/Call Ratio has now started to turn down. If this continues lower, this bodes well for the higher prices.
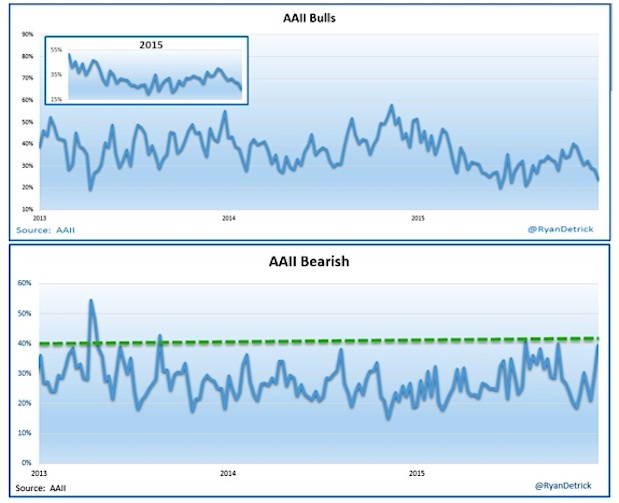
5. AAII bulls are at or near a 5 month low and AAII bears are up to the highest level in 2 years. Last week’s data shows Bulls were down 4.6 or 23.9%.
Alright, let’s delve into a few stock market breadth indicators (as of last week).
Market Breadth Indicators:
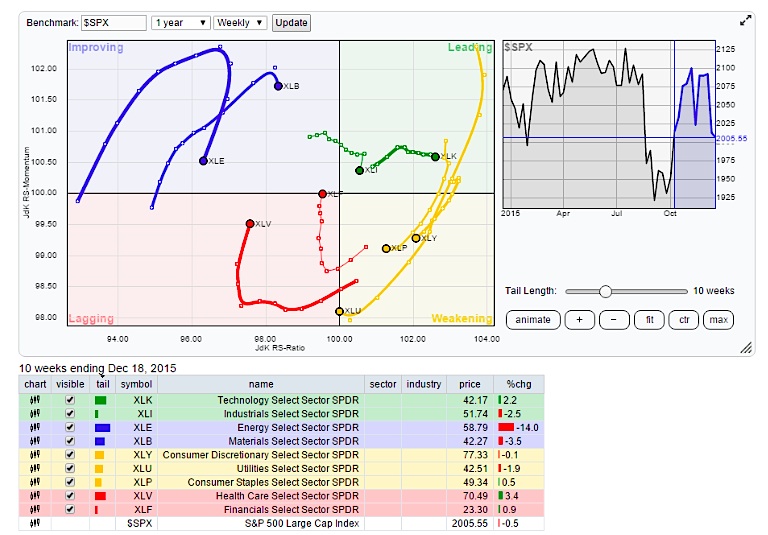
The Relative Rotation Graph (RRG) chart showing the leaders and the laggards among the 9 sectors as of last week.
continue reading on the next page…

: Showing Some Signs of Emerging Strength")
