Weekly Stock Market Outlook & Technical Review (August 12)
Here’s a look at some key stock market indicators and emerging themes that we are watching in our latest “Weekly Stock Market Outlook”:
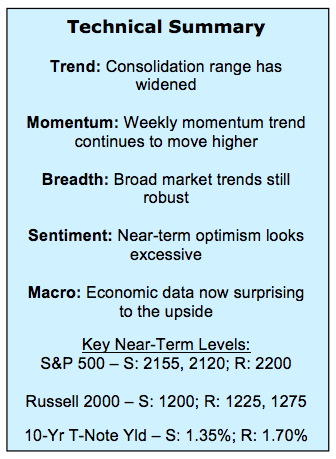
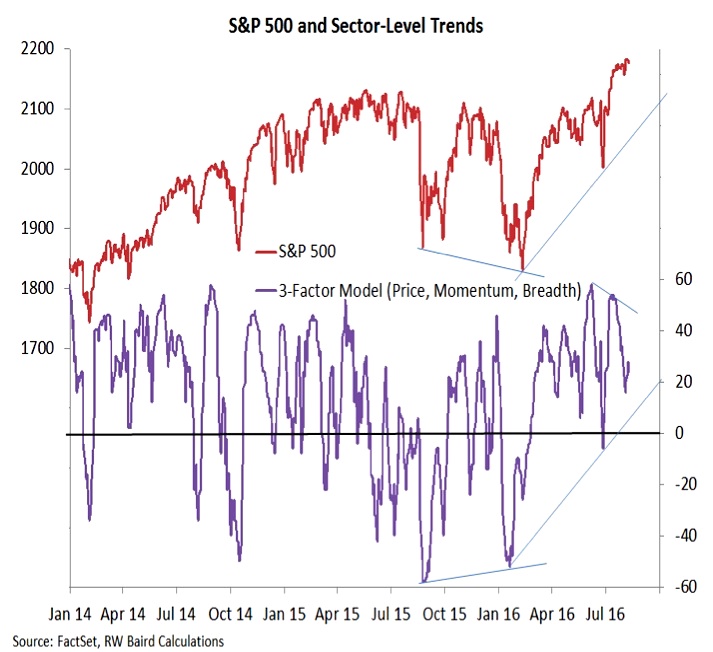
Breadth Improvements Hint At Upside Resolution – The S&P 500 Index (INDEXSP:.INX) and Dow Industrials (DJIA) have drifted into record territory, but the trading range environment of the past month remains largely intact. Beneath the surface, however, we are starting to see evidence arguing for a more pronounced break to the upside. Sector-level trends are improving and the percentage of S&P 500 stocks trading above their 200-day average has moved to its highest level since 2014.
Biotech & Broker/Dealers Trying To Re-Assert Leadership – After several years of relative leadership, both the Biotech Index (INDEXNYSEGIS:BTK) and Broker/Dealer index faltered (on an absolute and relative basis) in mid-2015. Now both are showing evidence they may be ready to return to leadership positions.
Utilities/Energy Ratio Heading For New Pattern? – Over the past two years, Utilities have been in a strong up-trend relative to Energy. New relative highs in Utilities have been followed by tests of support, which in turn have been followed by rallies to new highs. That pattern appears to be changing, and relative leadership from Energy could be emerging.
Stock Market Indicators – Indices & Sectors (click to enlarge)
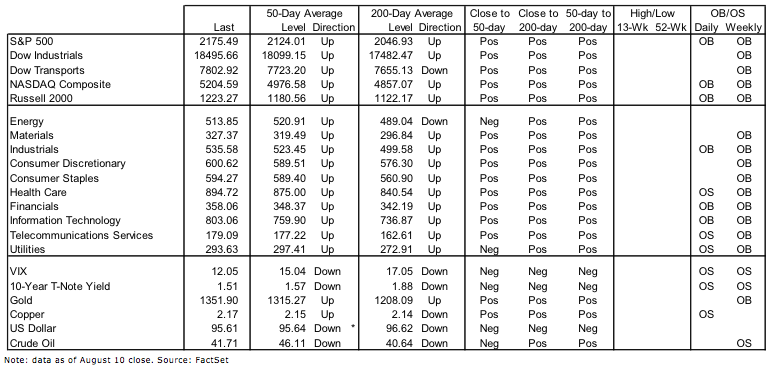
S&P 500 Index – Market Trends & Breadth
While the consolidation phase for the S&P 500 remains largely intact, improvements in some short-term breadth indicators suggest the rally is likely to resume and stocks could continue to work higher.
Last week we highlighted several breadth indicators we were watching. The version of the McClellan Oscillator that we calculate has moved into positive territory. As well, the number of issues making new highs are expanding (although the improvement here has been disappointing). And lastly, our sector-level trend indicator has turned higher. Further improvement in these market indicators would add conviction to the view that the rally is poised to resume.
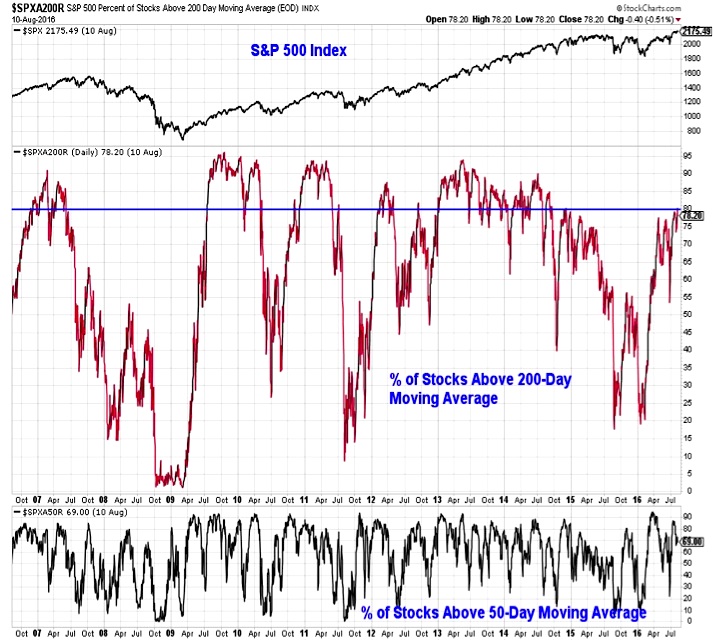
In addition to the stock market indicators featured last week, we have also seen improvement in the percentage of stocks trading above their 200-day averages. After only a modest down-tick in the second half of July, this indicator has fully recovered and this week moved to its highest level since 2014. This is evidence that even as the popular averages have largely marked time, improvements beneath the surface have continued to accumulate.
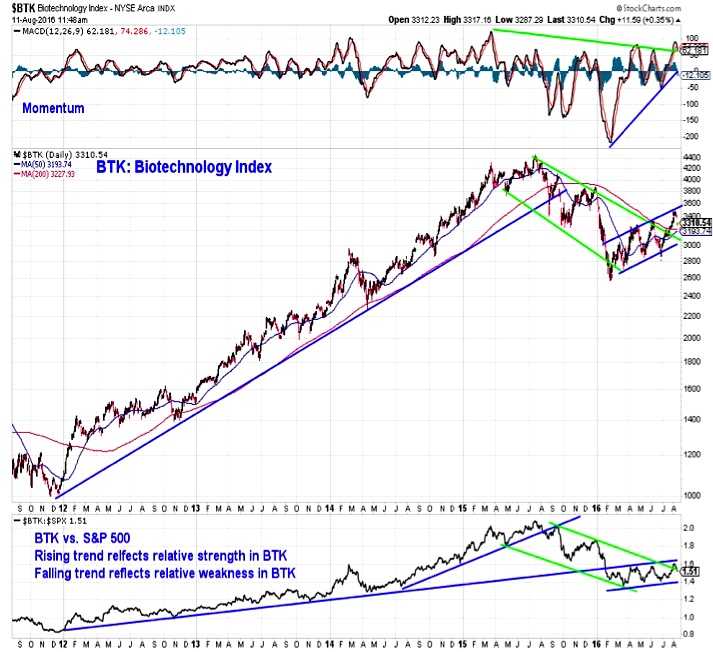
Biotechnology Sector
Heading into mid-2015, Biotechs were enjoying multi-year absolute and relative price up-trends. The weakness that emerged last year broke those up-trends, And while Biotechs bottomed earlier this year, they have struggled to make a meaningful rebound. Now, however, the absolute and relative price down-trends off of last year’s highs are being challenged as the up-trends off of the January lows are gaining momentum. Biotechnology Index (INDEXNYSEGIS:BTK) is charted below. Also see the Biotech Sector ETF (NASDAQ:IBB).
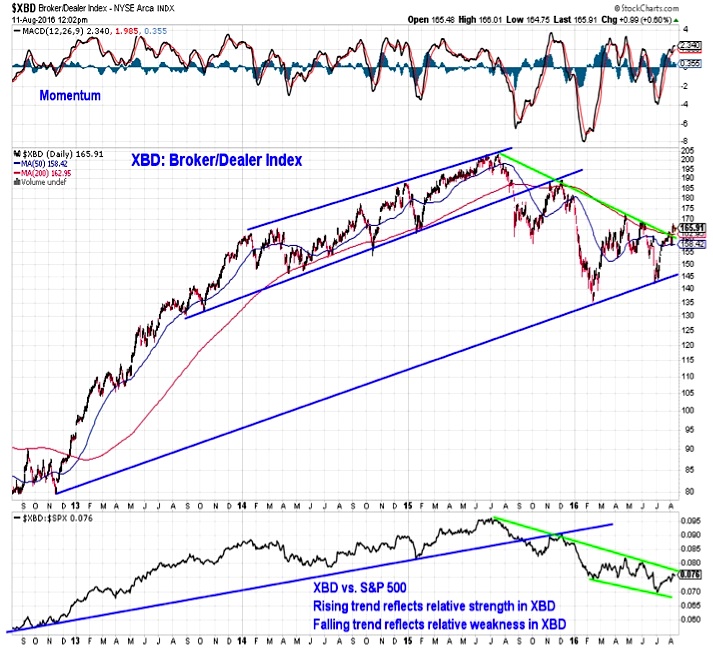
Broker/Dealer Index (XBD)
The weakness seen in the Broker/Dealer index has been even more persistent. While the index made an absolute price low in the first quarter, it made a lower low on a relative basis following the Brexit vote. On an absolute basis the Broker/Dealer index has broken above its down-trend and is poised to make a higher high. On a relative basis, however, a well-defined down-trend channel is still intact and more work needs to be done before arguing that a relative price up-trend is emerging.
continue reading on the next page…

: Showing Some Signs of Emerging Strength")

