Here’s a look at some key stock market indicators, charts, and themes that we are watching.
This Week’s Stock Market Outlook:
Noise Remains Undiminished – Intra-day swings in stock prices continue to be seen at an almost dizzying rate, but for all the noise there is little evidence of resolution. Nerves, however, show evidence of fraying. Individual investors are both less bullish and less bearish this week, while advisory services are both more bullish and more bearish. Active investment managers sharply reduced equity exposure after a big increase last week.
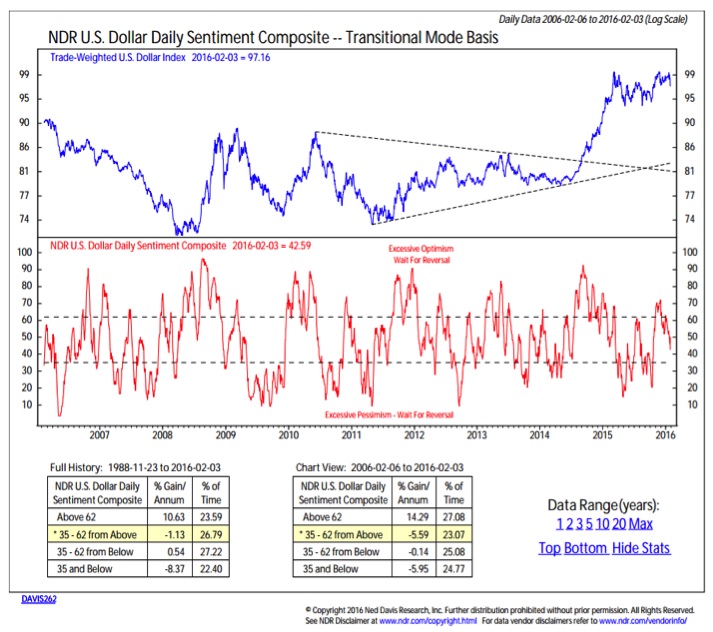
Dollar “Uptrend” Disappears – This week’s decline in the US Dollar brings to light the fact that the much-referenced up-trend in the dollar has really been a broad trading range over the past year. With pessimism building, there could be more downside ahead.
Laying the Groundwork For Better Breadth? – At the margin we are seeing evidence of slightly better market breadth. It is too early to draw a strong conclusion with this stock market outlook, but market breadth divergences do not come out of nowhere. The groundwork needs to be laid now if we are going to see positive market breadth divergences if/when we test the January stock market lows.
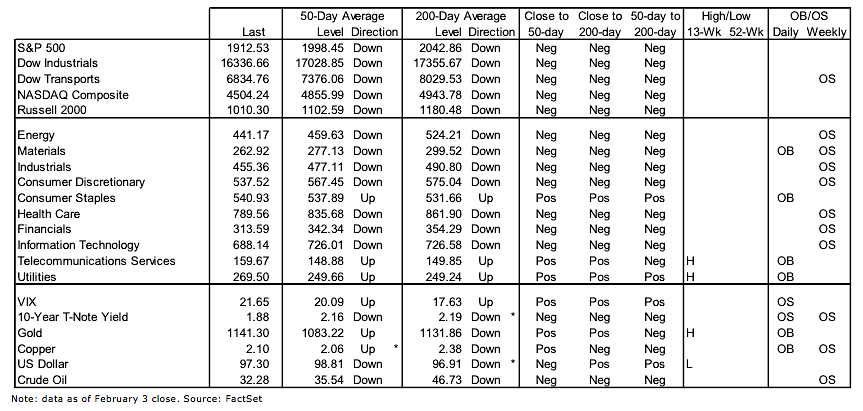
Stock Market Indicators – Indices & Sectors (click to enlarge)
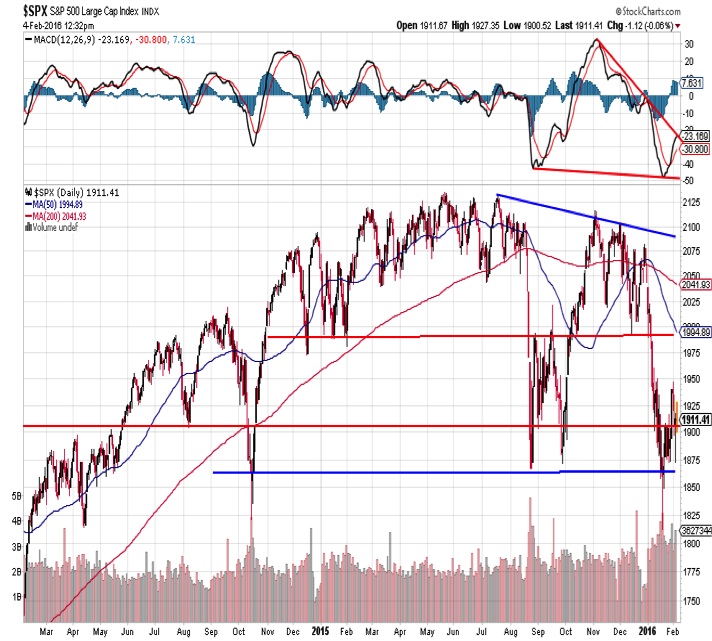
S&P 500 Index
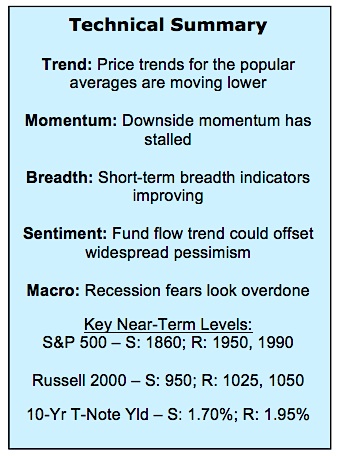
The intra-day noise can certainly distract from the bigger picture. The S&P 500 has moved off of support near 1860. While downside momentum has stalled, stocks have not gotten in gear to the upside and the counter-trend rally toward resistance remains largely elusive. Momentum has not provided a positive divergence and so while stocks could work higher in the near term (1950 and 1990 are resistance levels) it seems premature to argue that a change in trend is underway for the stock market.
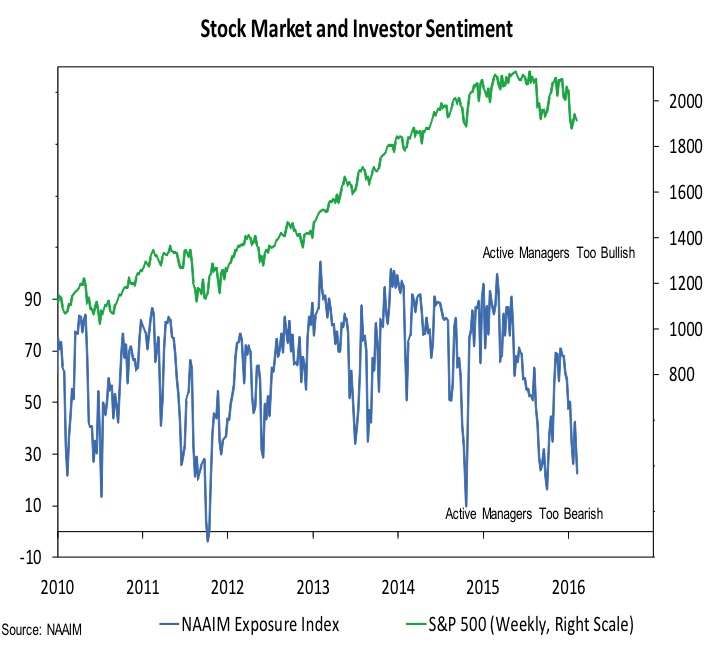
Investor Sentiment
While the noise may be muted on the daily chart, the effect on investor sentiment can be seen. The Investors Intelligence data showed an increase in both bulls and bears this week, while individual investors reacted in the opposite direction, with the AAII investor sentiment data showing fewer bulls and bears. In both surveys, bears continue to outnumber bulls. Active investment managers have not had any more luck in filtering out the noise. Last week’s rise the NAAIM Exposure index (from 26 to 42) was more than reversed this week as it dropped to 22.
US Dollar Index
The value of the dollar (versus other currencies) surged in the second half of 2014, but since March of last year, it has been moving sideways in a broad trading range. With this week’s decline, the year-over-year change in the dollar is basically zero. Excessive optimism for the dollar is being unwound and as pessimism continues to build, the dollar could come under additional pressure.
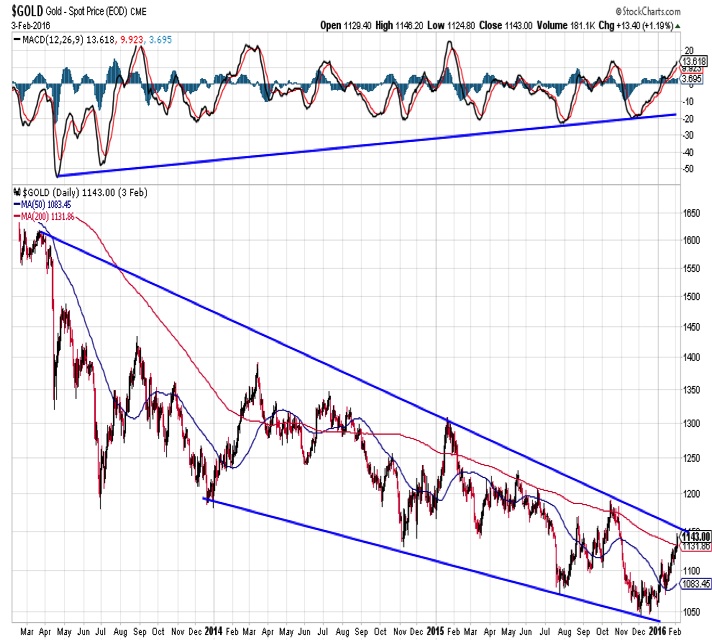
Gold
Discussion of the dollar usually leads to thoughts about gold, so here is a chart on gold that goes back several years. Gold has rallied off of its late-2015 lows and has moved toward its 200-day average. Rallies over the past couple years have run into headwinds near or just above the 200-day. There is little indication that this rally is going to be different (and produce some follow-through), but a close above $1200/oz could be a good start (as it would break the pattern of lower highs and lower lows).
continue reading on the next page…

: Showing Some Signs of Emerging Strength")
