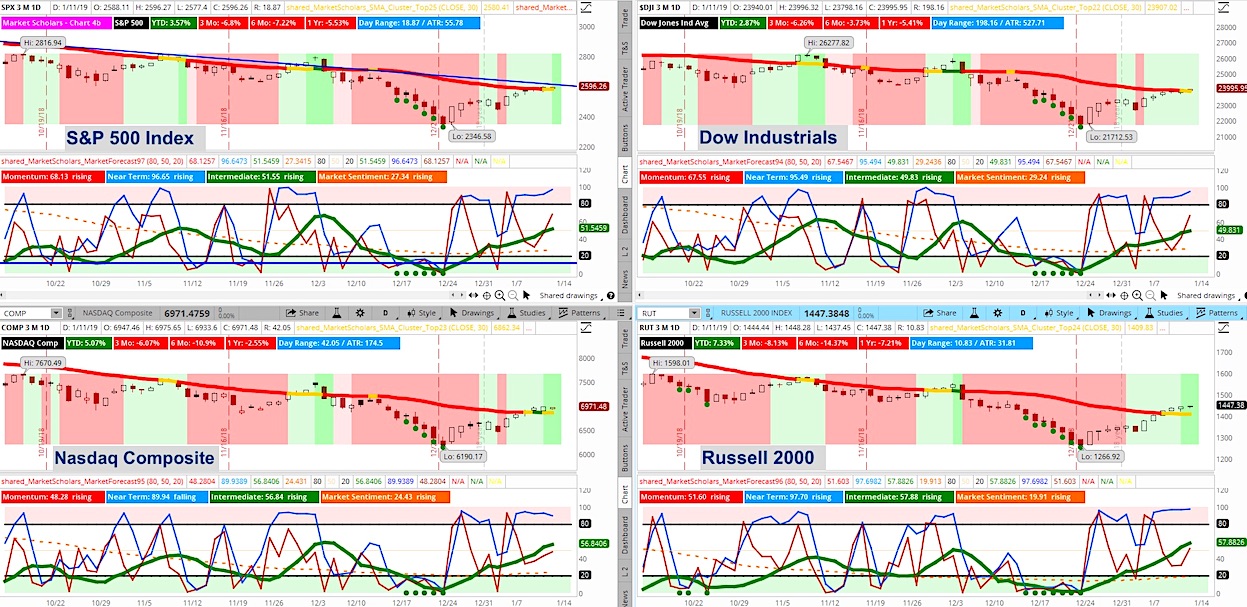
The S&P 500 (SPY) closed Friday with its first loss of the week (less than half a point loss) after five straight up days and nine out of 11. The S&P 500’s intermediate line closed above 50, which typically starts a 1-3 month expected run higher. See chart further below (and in video).
That said, a few signs suggest we may get a short-term hiccup first. Today’s video goes through them in depth. Here’s an overview:
The 6-week moving average is still falling. Strong intermediate runs start when the intermediate line (green) crosses above 50 AND it closes above a rising 6-week moving average.
The intermediate line is coming off extreme lows (6 straight oversold clusters is very rare). There is usually a short pullback in the intermediate line when it hits the chart’s mid area when it’s coming up from strong oversold levels.
The near-term line (blue line) has been above 80 for five days. Its run typically lasts 7-12 days – longer when it starts new intermediate trends but shorter when the intermediate line is coming off strong oversold levels. This suggests we may get that short-term pullback sooner rather than later.
The S&P 500 hit the 50-day moving average, which can act as a resistance level when coming off extreme lows below the 200-day SMA. Because the S&P 500 fell so far below the 50-day SMA, there’s a good chance the next leg lower will not hit prior lows or reach new lower lows that is normal when trading after a “death cross.”
Subscribe to the Market Outlook daily email list to get the daily and weekly overbought and oversold Market Forecast clusters watchlists for the S&P 500.
Weekend Market Outlook Video – Week of January 14:
Below are additional bullet points of market items discussed in this weekend’s video:
- The 8-day EMA crossed above 17-day EMA but neither line has closed above the 30-day SMA, which is still falling. Another reason to expect short-term weakness.
- When MACD comes off extreme lows, it also usually has a hiccup when it reaches the chart’s midpoint before making a run towards strong higher levels.
- Seasonality for January also implies there could be weakness in the next couple of weeks after a strong start to the year.
- Trading range and volume were very light Friday, which is normal for stocks as they approach resistance levels. Both hit levels near 52-week lows for their averages
- The 4-week range is going to start shrinking next week, which will also bring the 4-week midpoint lower. This will allow for a short-term S&P pullback without getting into the range’s lower half.
- Volatility continues to move lower and is approaching its last support level. This pattern can lead to one last short-term bounce in volatility before a more sustained break below its support. This would also solidify the new bullish intermediate trend once it occurs.
- CPI is falling strongly on a headline basis further putting pressure on rate hike odds for 2019, despite persistent strong estimates for Q4 GDP. It will be a busy week on the economic calendar as well as earnings reports.
- Risk assets have strong move off Christmas Eve lows with big gains in crude oil and small-cap stocks in particular. On the other hand, the U.S. dollar is moving down towards its 200-day MA.
- Cyclical sectors doing well during oversold bounce but safe havens areas are still the strongest performers since October 3 – which includes the entire move lower and subsequent 10% post-Christmas rally.
Twitter: @davidsettle42 and @Market_Scholars
Any opinions expressed herein are solely those of the author, and do not in any way represent the views or opinions of any other person or entity.

: Worrisome to Broader Market?")

