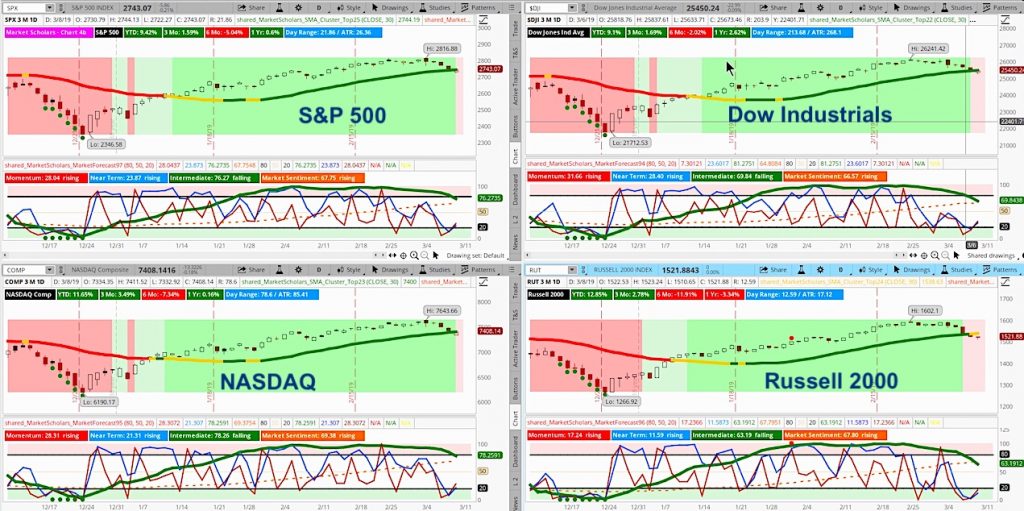
The S&P 500 has been on a strong bullish run but is now showing signs of an intermediate (green line on Market Forecast indicator) pullback.
Bearish short-term investor sentiment this week confirms the change in direction. Of course, any bearish moves are weak compared to the strong bullish move we’ve had off the Christmas Eve low.
Fibonacci retracement levels suggest a move towards 2640 within another week or two is a very real possibility. A 170-point drop from last week’s high would still only be a 38% retracement.
Heikin Ashi weekly candles showed a transition candle this week after weeks of strong bullish candles. This pattern suggests a week or two or weakness based on previous reactions to transition candles.
The regular weekly candlestick on the S&P 500 showed a strong engulfing pattern that “engulfed” the past two quiet weeks and nearly hit the midpoint of the strong bullish week before that.
The S&P 500 is showing 3 red arrows on 30-day MA, MACD and Stochastic. In the past on uptrends, this pattern set the low point but didn’t always produce an immediate bounce. In 3 consecutive days, the S&P 500 broke the 8-day EMA, 17-day EMA and 30-day SMA. MACD and Stochastic are both falling below their moving averages.
A strong late intraday rally into the close kept the Friday from being as bearish as it could have been. The S&P 500 closed at its high of the day and above yesterday’s low point.
Subscribe to the Market Outlook daily email list to get the daily and weekly overbought and oversold Market Forecast clusters watchlists for the S&P 500.
Weekend Market Outlook Video – Week of March 11:
Below are additional bullet points of market items discussed in this weekend’s video:
- Volatility bounced back into bearish territory and suggests the long-term bullish trend still has some correcting to do before it gets set for the long grind higher.
- Long-term bonds were this week’s best performer – along with gold and U.S. dollar. Typical safe haven pattern. Small-cap stocks gave back some of their strong post-Christmas gains.
- Weak jobs number and low GDP estimates are keeping rate hike odds down to nothing for 2019. This macro environment is bearish for bond yields. It’s also bearish for USD but the dollar benefitted from weakness in Euro this week due to dovish European Central Bank.
- Safe haven sectors show strong relative strength for the past year. This outperformance typically leads to strong gains ahead in the long term for cyclical sectors. You’re already starting to see a slow shift out of rate-sensitive areas into Technology and Communication Services.
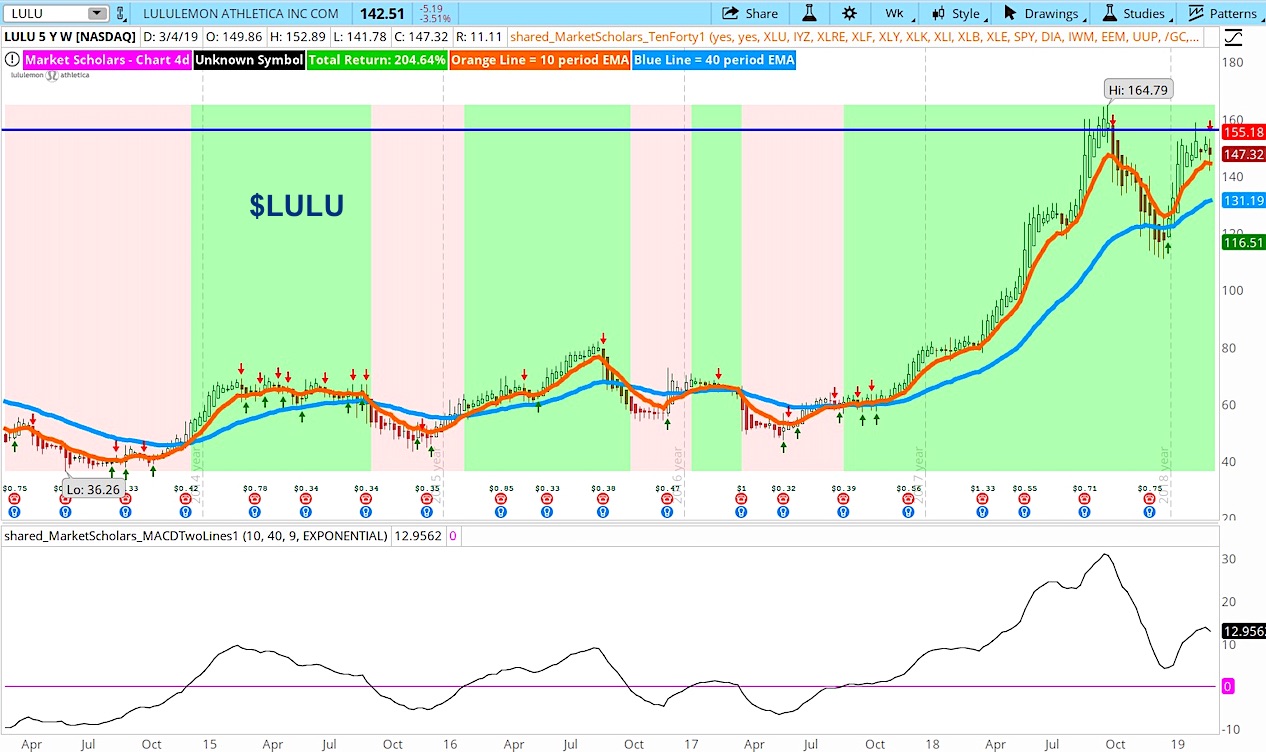
- Bearish trade example in Consumer Discretionary sector and retail industry. Stock broke down below technical support and shows bearish signs on other technical indicators. This is one way to take advantage of any intermediate pullback in broad market without being aggressively bearish due to long-term bullish expectations.
Twitter: @davidsettle42 and @Market_Scholars
Any opinions expressed herein are solely those of the author, and do not in any way represent the views or opinions of any other person or entity.


")
 Rolling Over At Key Fibonacci Level?")


