The S&P 500 (NYSEARCA:SPY) is starting an expected near-term pullback.
Near-term runs (blue line on Market Forecast indicator) above the 50th percentile are shorter when the intermediate line (green line) is coming up from below the 20th percentile – see video.
There is a bullish near-term stock market divergence still in play for S&P with target at 2800. S&P finished back above the previous intermediate low (near 2700) after a fakeout move below it last week. The last two times this occurred – Brexit and 2016 election – were fakeouts.
The S&P 500 closed near its 200-day MA after closing below it last week. It’s showing a long lower shadow with a new low this week, which is a strong reversal pattern. The Russell 2000 is also showing a candlestick reversal pattern on its weekly chart.
The S&P 500 closed above its 8-day EMA and tested the 17-day EMA for short-term resistance.
There’s a good chance for the S&P to trade above its weekly Heikin Ashi candle open next week, and its 4-week midpoint and this week’s high. This would also be a good sign considering the index still trades in an extremely wide 4-week range.
Weekend Market Outlook Video – November 3:
Below are additional bullet points of market items discussed in this weekend’s video. Learn more about our service over at Market Scholars.
- ATR did not peak above the 2% mark. Usually, bear markets begin with a bigger volatility jump. Bull market lows occur at the 2% mark.
- Volatility (INDEXCBOE:VIX) is starting to moderate from high levels – closing below 20 and below 1 on the VIX:VIX3M ratio.
- Strong jobs report and wage inflation pushed long-term yields higher but short-term yields were less affected as interest rate hike odds are dropping for 2019 meetings
- Apple earnings impacted Technology but Consumer Discretionary and Communication Services still are leading the bounce off Monday’s low. Materials and Industrials are also performing well and would be expected to show long-term outperformance if the Dollar breakout doesn’t hold
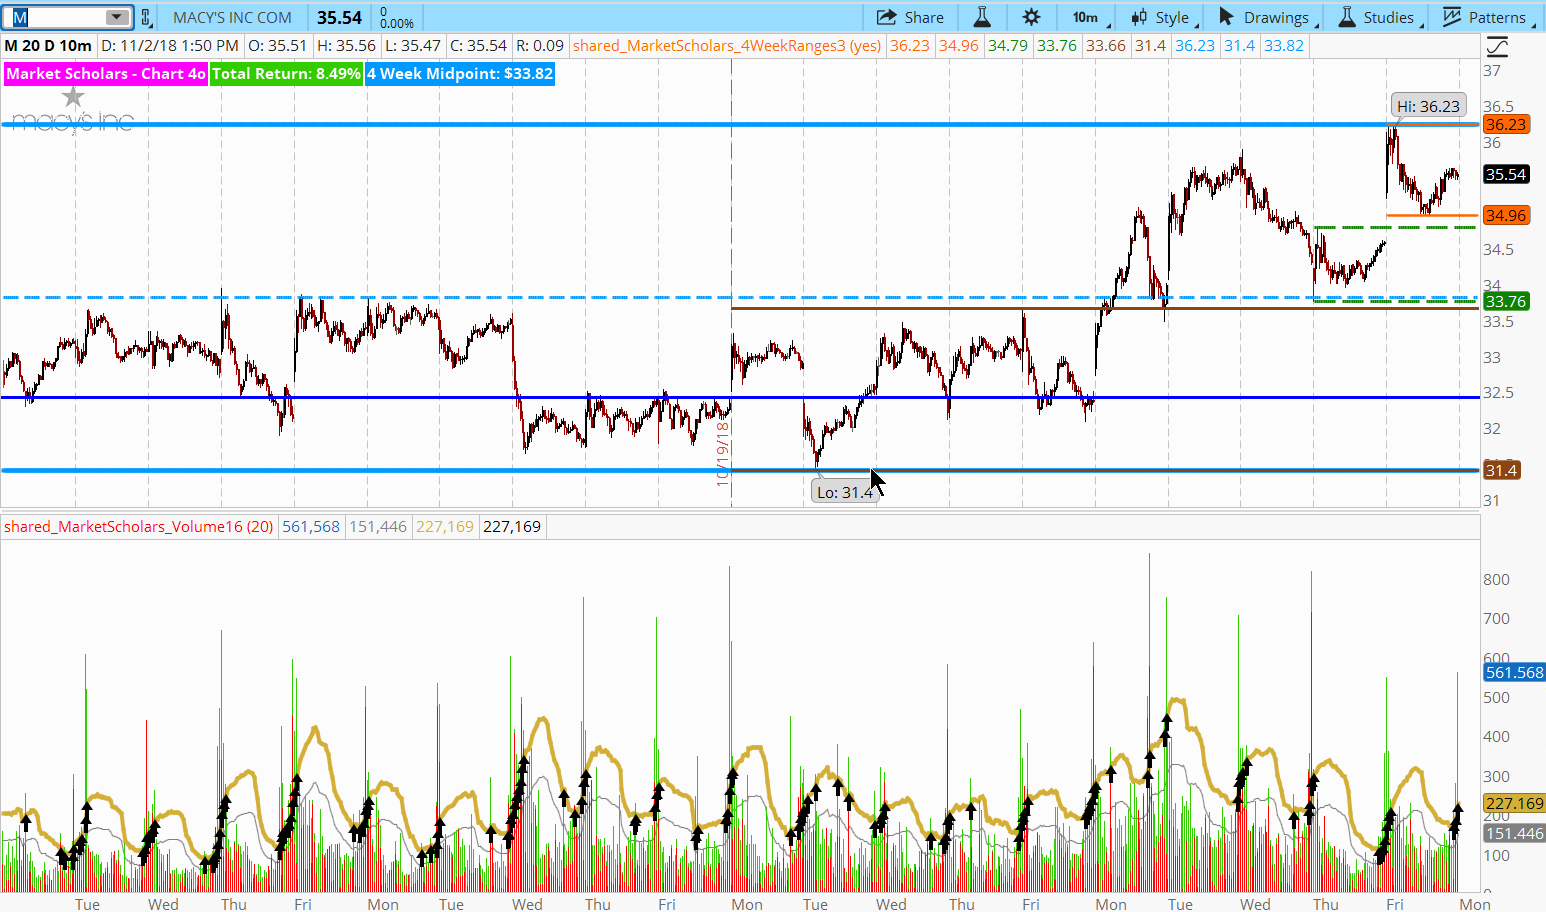
- Bullish trade idea in Consumer Discretionary area that are showing multiple bullish bounce signs. There could be many more of these types of signals in the next few weeks if the market follows its seasonal trends and reverts to the mean away from its extreme oversold levels.
Twitter: @davidsettle42 and @Market_Scholars
Any opinions expressed herein are solely those of the author, and do not in any way represent the views or opinions of any other person or entity.


