 Ready for another week of market action? There’s plenty of moving parts here and the long holiday weekend in the U.S. makes for an action packed 4 trading days. Let’s review some macro themes, news, and the week ahead in the global financial markets.
This post also went out in our “Market Navigator” newsletter (subscribe here, it’s free). The aim here is to provide investors with insights into the global markets so they can better understand the global story.
Macro Themes
Over the past 3 years or so, I have written several times about why investors have been migrating capital to the U.S. equities markets and the U.S Dollar:
- What The US Dollar – Equities Correlation Is Telling Us
- 3 Reasons Investors Are Eating US Equities For Breakfast
- Why US Equities Aren’t Taking Cues From The US Economy
If you are an investor in southern Europe, Russia, China, Japan, etc, you are likely allocating a higher percentage of your portfolio to US Equities (i.e. the S&P 500) than you were 5 years ago. Some of this is due to weaker economies, some of it is due to low/zero rates, while some is due to weaker currencies. But even more important is the current scale, depth, and reach of the US Dollar.
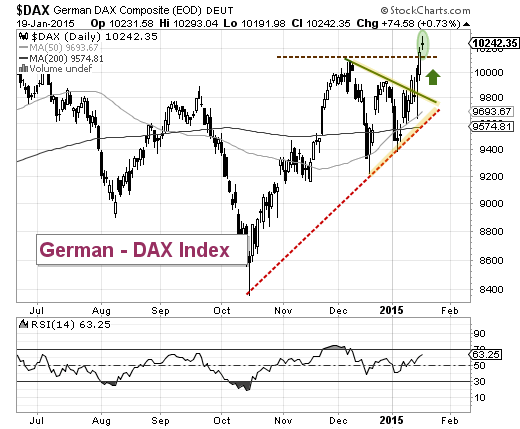
An example on a more localized scale would be the Euro Zone. You can see capital flowing from into Germany, as it’s the strongest market. Just look at the German DAX (German stock market) – it’s outperforming all other Euro-based stock market indexes.
German DAX Index – attempting to break out?
Understanding how capital is flowing is the key to better understanding the global financial markets. Simply break down the asset classes by Equities, Bonds, Commodities, and Currencies (even real estate). Then look at how each is performing under any given time frame. You can then drill down further to look at countries, types, etc…
So this takes us to one more theme worthy of mentioning: BONDS. The steady flow of capital into bonds over the past 6 months is telling us that investors are concerned – See the 20+ year US Treasury Bond ETF (TLT). This was likely an early “tell” that Europe was about to get volatile. During this same time, STOCKS have underperformed. This has my antennae up and I am staying cautious on equities over the near-term.
News & Economics
- ECB Faces Critical Test Of ‘Whatever It Takes’
- Federal Reserve Governor Jerome Powell Speaks On Tuesday
- US Housing Data: Building Permits on Wednesday (8:30 am EST), Existing Home Sales Friday (10:00 am EST)
- Initial Jobless Claims Thursday (8:30 am EST)
The Week Ahead
So everything is on cruise control, right? NOT SO FAST. It sure felt that way heading into October before the rug was pulled out from under investors feet. That was the initial volatility shock and signal that the coming weeks would be volatile. As I mentioned above, bonds are now outperforming equities. And when taken together with the recent choppiness and volatility in the global financial markets, it may signal a turbulent rangebound equities market for the coming weeks (perhaps as low as 1850 to as high as 2150 on the S&P 500).
This week we have news coming from the ECB and expectations are high. A couple years back, Mario Draghi said he’d do “whatever it takes.” Well here’s his chance. The pressure has been ratcheted up over the past several weeks with a continuing stream of poor economic data, Greek elections concerns, and the Swiss National Bank removing the Franc to Euro peg. I expect the entire week to feel like one long Fed Day, so be sure to stay focused and don’t get caught up in your emotions.
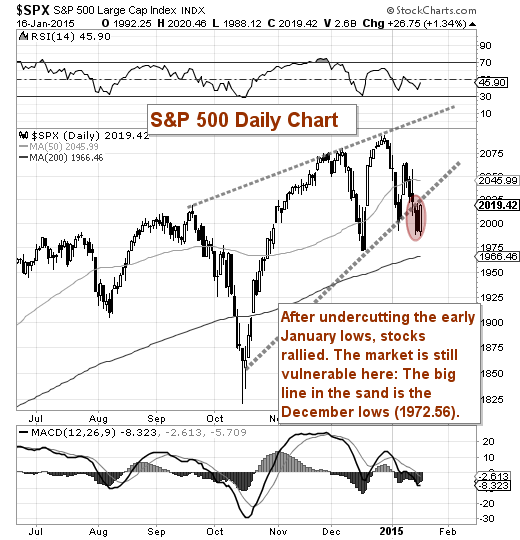
After making new lows for the month, the US equity markets rallied on Friday. Looking at the S&P 500 , there are two things Bulls and Bears should be watching this week: A continuation of the rally back above the broken trend line. This may signal another retest of the highs. On the flip side, another decline this week would open the door for a retest of last week’s lows and possibly of test of the December lows (1972.56). I think the December lows are critical to the equation: Hold and we go higher, break down and we re-visit the price discovery we saw in October.
S&P 500 Chart
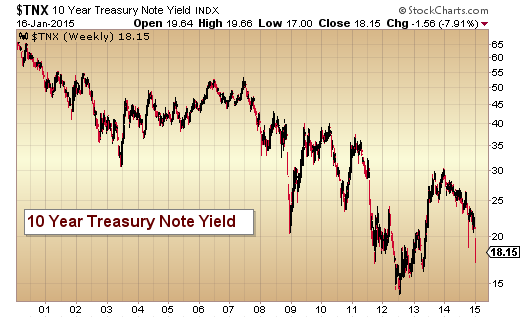
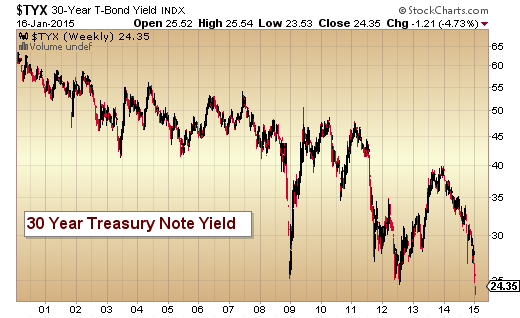
Bonds, Bonds, Bonds… Check out the low yields on the 10-year and 30-year. And these are 15 year charts. Yikes!
10 Year Treasury Note Yield Chart
30 Year Treasury Note Yield Chart
Trade safe and have a great week.
Follow Andy on Twitter: @andrewnyquist
No position in any of the mentioned securities at the time of publication. Any opinions expressed herein are solely those of the author, and do not in any way represent the views or opinions of any other person or entity.


