Is should be no surprise to anyone interested in the markets how bad General Electric’s stock (NYSE: GE) has performed over the past 2 years, down nearly 65% from December 2016.
I have no idea if GE is bottoming here or where the company will be in 5 years, but I do see an interesting trade setup presenting itself on the stock chart…
From late March to August, GE looked to be finding support around at the 12.75 level. That eventually failed, turning into resistance through September. This is called Polarity, which is nothing market participants haven’t seen before.
On October 1st, news hit about a shakeup at GE (Disclosure: I don’t know what it was besides a new CEO and that is all I care to know.) Regardless, GE saw 350% above average volume come into the stock that day.
Capitulation, accumulation or distribution?
I don’t know but the stock has gone nowhere but higher since then. When such a dog of a stock changes it’s character, it should not be ignored.
GE Stock Chart
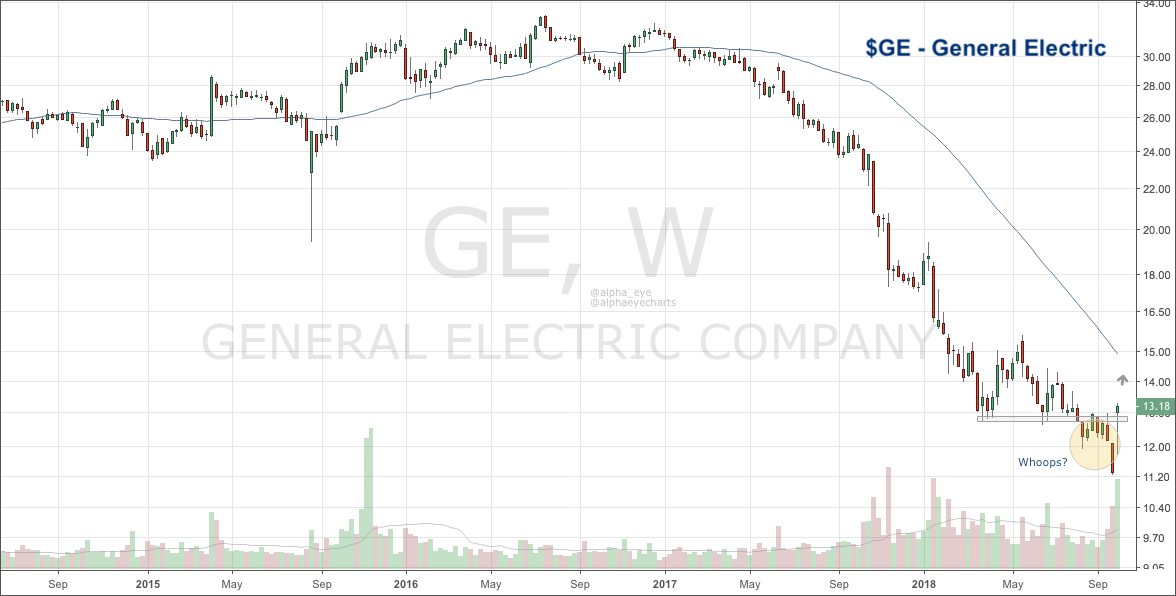
If GE is above $13, I want to be long. With GE above that level, I see no reason why this cannot continue higher. I believe there is juice in this with such a potentially massive false breakdown setup and bearish sentiment towards the stock.
Personally, I will be playing this trade with call options to help protect against any gap down risk. Let’s see what happens next.
Thanks for reading!
Twitter: @AlphaEyeCharts
The author is currently long GE calls at the time of publication. Any opinions expressed herein are solely those of the author, and do not in any way represent the views or opinions of any other person or entity.


