As we’ve mentioned in previous articles, we watch the ratio between the 3 Month Volatility Index (INDEXCBOE:VXV) and the spot Volatility Index (INDEXCBOE:VIX). This gives us a sense of whether traders are more concerned about the near-term or the longer term and are willing to pay to protect stock market positions (equities) against those concerns.
And given the mean-reverting nature of volatility, getting long the stock market – specifically the S&P 500 Index (INDEXSP:.INX) or ETF (SPY) – when the VXV drops relative to the VIX has been a favorable entry point.
This makes sense because volatility rises when equity markets and stocks fall, prompting traders to buy short-term protection. Hence the spike in the Volatility Index (VIX).
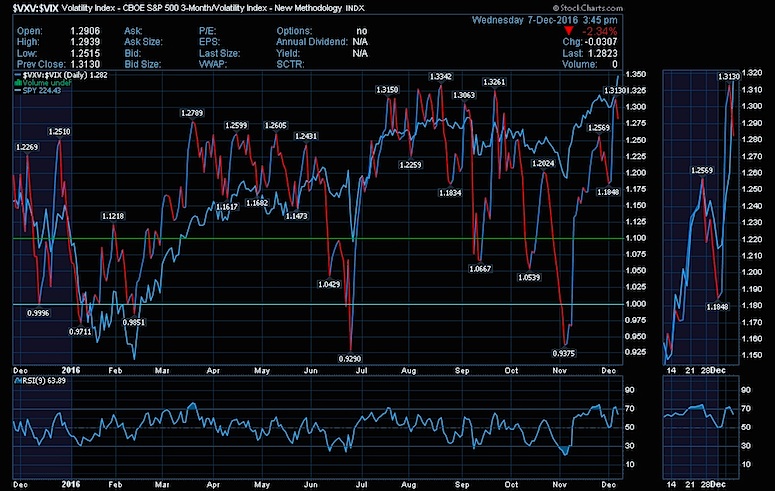
Checking in on the VXV to VIX ratio after yesterday’s surge in equities, we can see that near-term protection is relatively cheap compared the cost of protection three months out. While this doesn’t mean that stocks will pull back, it does make the current stock market levels less attractive as an entry point.
VIX:VXV Volatility Ratio Chart – For Buying/Selling Opportunities
If you’re looking to participate in the rally, you may want to monitor this ratio for signs of a better place to buy. And if you’re long, this ratio can serve as a means to tighten stops if we do see a market pullback. Overall, it’s a useful ratio to add to your trading toolkit.
Thanks for reading!
Any opinions expressed herein are solely those of the author, and do not in any way represent the views or opinions of any other person or entity.
")


")
