This week I appeared with David Keller on Stockcharts Final Bar.
We discussed how the market is at a precipice.
And no doubt, the words I wrote on April 20th Daily “Now That “Stagflation” Has Gone Mainstream” some 5 months later are buzzing in my head:
My prediction-SPY QQQs DIA continue to rally-until IWM cannot clear $200-then everything sells off again.
That is precisely what happened.
Looking at the Volatility chart and our plug-ins which include 6-month calendar ranges, momentum, and leadership indicators, we can now ask…
Was that the sell off this past week, or are tougher times just getting started?
I do not use the “precipice” word lightly.
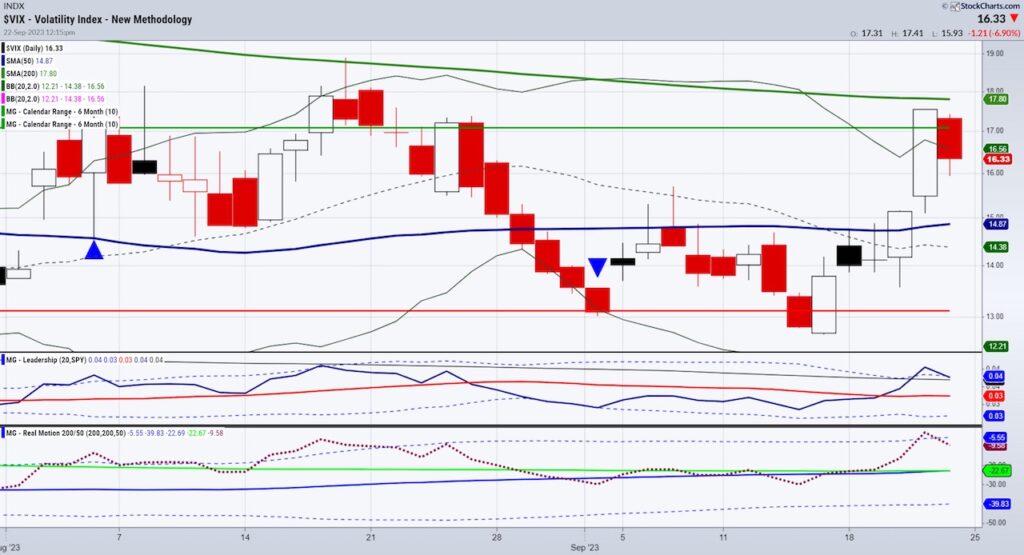
Cash VIX rallied right to the horizontal green line or July 6-month calendar range last Thursday, then backed off Friday but traded within the range of Thursday (inside day).
Note that the same type of move happened August 17, 18 and 21.
In fact, VIX took out the calendar range high and failed to hold above there once it was obvious that the 200-daily moving average above, another green line, could not clear.
Hence, the sell-off and rally in equities until September 15th when VIX broke but then quickly reversed above the July calendar range low (red line).
VIX is now outperforming the SPY.
And momentum in our Real Motion indicator shows us that there is a mean reversion sell signal in VIX ending this week.
Precipice?
Now we must ask ourselves as September ends, whether the market can bounce back leaving VIX in the dust.
“The last 9 times the S&P was lower in both August and September saw Q4 close higher (back to 1981). Higher 9 for 9 and up 9.1% on average.” Ryan Detrick.
Can we make it 10 for 10?
Let’s ask Granddad Russell 2000 and Granny Retail.
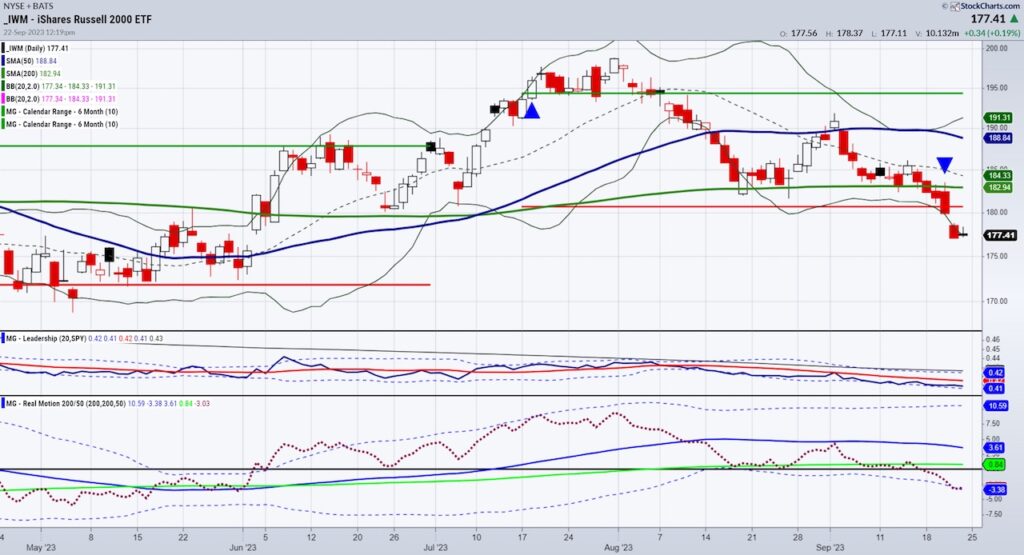
The Russell 2000 (IWM) trades below everything: the July calendar range low, the moving averages, the SPY, and sits on the Bollinger Band in real motion momentum. IWM sits there as in mean reversion or more weakness coming?
The best we can say is that IWM is holding above May and June lows. It also has not filled the gap it left when it gaped higher on June 2nd.
However, note the January 6-month calendar range low held up in June. Not so much right now.
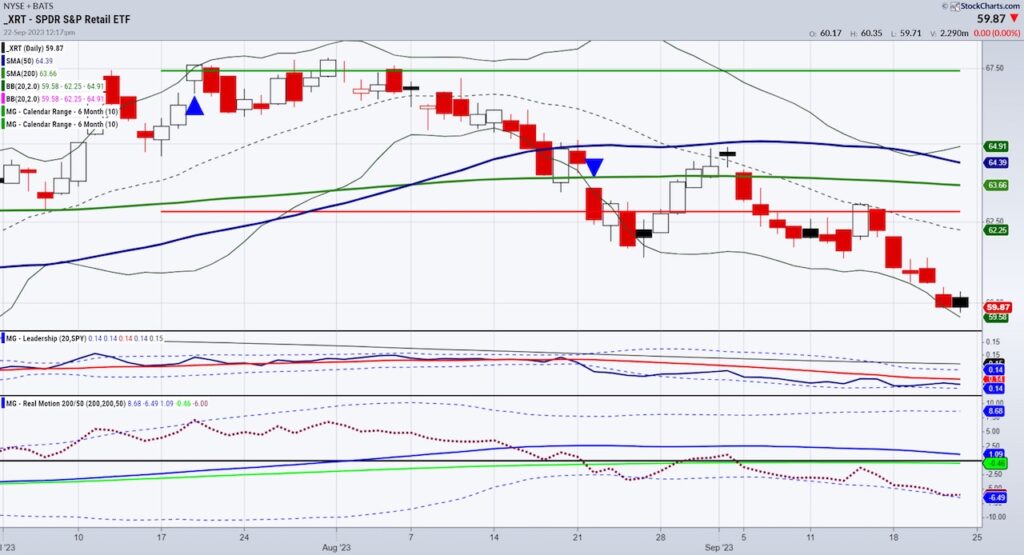
Then there is Granny Retail (XRT).
We have written a lot about this sector’s underperformance.
Now, similarly to IWM, XRT trades below everything: the July calendar range low, the moving averages, the SPY, and sits on the Bollinger Band in real motion momentum. XRT sits there as in mean reversion or more weakness coming?
Nonetheless, Granny is weaker than Gramps. The gap that IWM is holding from its gap up June 2nd, has been filled this past Thursday and Friday in XRT.
Bottom line:
A move over 18.00 or the 200-DMA in VIX, coupled with more downside pressure in IWM and XRT (watch momentum), could spell another leg lower-perhaps to 170 in IWM and 57 in XRT.
Then, we look at the monthly charts and our 80-month moving averages on both, which have held since the heart of COVID.
And, to Ryan Detricks’ point, should we see that mean reversion in XRT and IWM, plus watch VIX to fail 15.00-16.00, then we could get a bounce at least, if not more.
Precipice: a very steep side of a cliff or a mountain. Parachute anyone?
Twitter: @marketminute
The author may have a position in mentioned securities at the time of publication. Any opinions expressed herein are solely those of the author and do not represent the views or opinions of any other person or entity.


