 The month of May has tended to be a volatile month for the stock market. How volatile has it been? I was wondering myself, so I decided to put together a VIX seasonality study to get a better feel on what kind of volatility to possibly expect for the month of May. Let’s take a look at the results of this volatility study below:
First, below is a monthly chart of the Volatility Index (VIX) that goes back to 2004. As for VIX seasonality, it shows 2 things. The first thing it highlights is the May peak % gains of the VIX over the last 10 years. What I found fascinating is that the VIX at some point, in the month of May, has been higher on 10 out of 10 occurrences. And the average peak % gain is +33.55%.
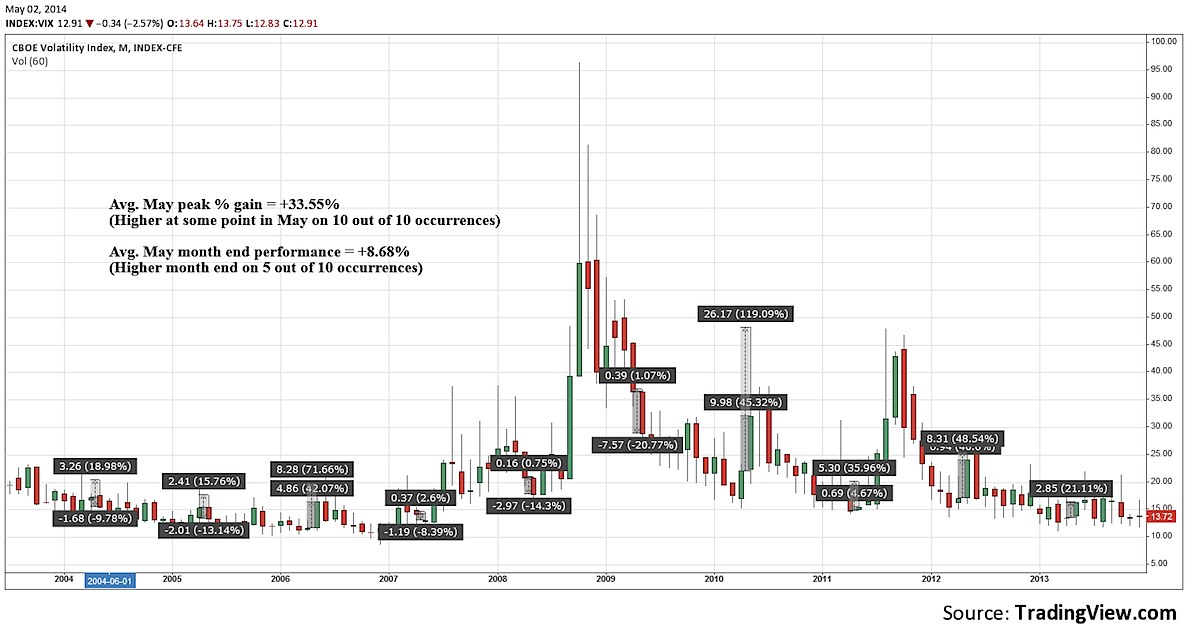
The second thing it shows is that the month end performance of the VIX isn’t as good as its peak gain for the month. It finished the month higher on 5 out of 10 occurrences with an average month end % gain of +8.68%.
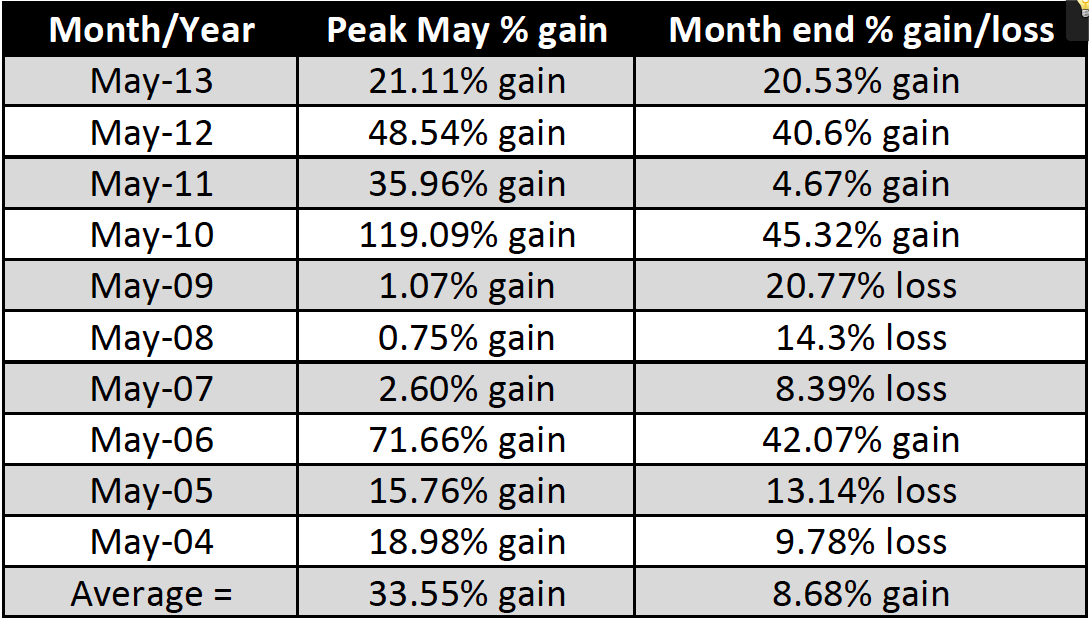
Here are the results of the study in table form:
Based on this study, it shouldn’t surprise anyone if there is an increase in volatility during the month of May. That said, one has to be open to possibility that we may see a continuation of the relatively low volatility environment that’s insulated the markets for much of the past 2 years. Thanks for reading.
Data sourced from the TradingView price range tool.
Author is long VIX call spreads at the time of publication. Any opinions expressed herein are solely those of the author, and do not in any way represent the views or opinions of any other person or entity.

: Showing Some Signs of Emerging Strength")
