The Dow Jones Utilities Average has enjoyed a 20-year bullish rising price trend.
But a recent multi-month sell-off has bulls on the ropes and wondering if the lights are about to go out on utilities.
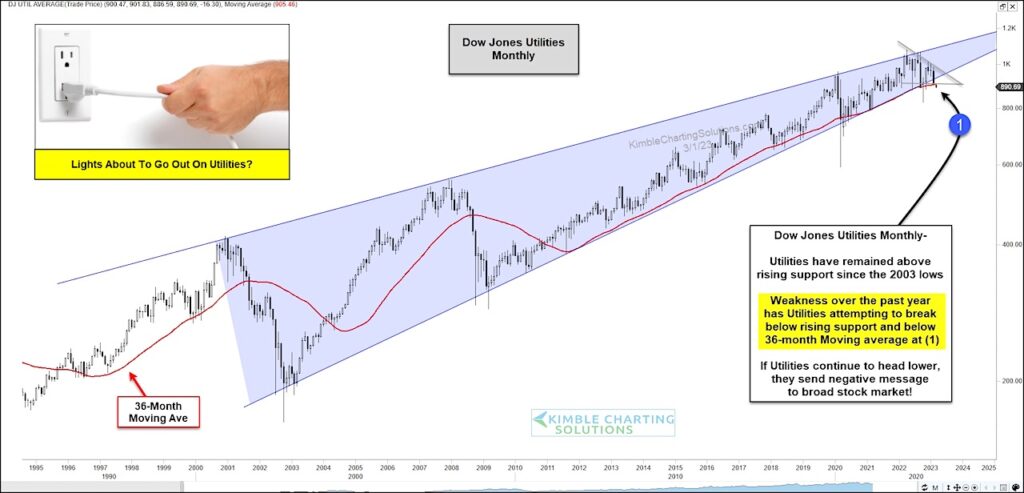
Today’s chart is a long-term “monthly” chart of the Dow Jones Utilities Average that captures this bullish trend, along with the recent decline.
As you can see, the Utes are currently testing triple support at (1), comprised of the 20-year rising wedge, 36-month moving average and the bottom of a newly formed descending triangle.
And considering, the recent weakness, utilities bulls need to hold this support or risk a much bigger decline.
Should the Utes break below support at (1), they will also send a concerning message to the broader stock market. Stay tuned!
Dow Jones Utilities Average “monthly” Chart
Note that KimbleCharting is offering a 2 week Free trial to See It Market readers. Just send me an email to services@kimblechartingsolutions.com for details to get set up.
Twitter: @KimbleCharting
Any opinions expressed herein are solely those of the author, and do not in any way represent the views or opinions of any other person or entity.


