Today’s chart is the Utilities Sector SPDR (XLU). The overall thesis here is that utilities are starting to emerge as potential leadership.
For the record, Utilities stocks have not been working on a relative basis since the market low in March.
So the question now is: will the Utilities Sector ETF (XLU) have staying power to remain above 59.50 (key support level) and break to new highs above 62.50?
If so, this could suggest much further upside in a traditionally defensive group.
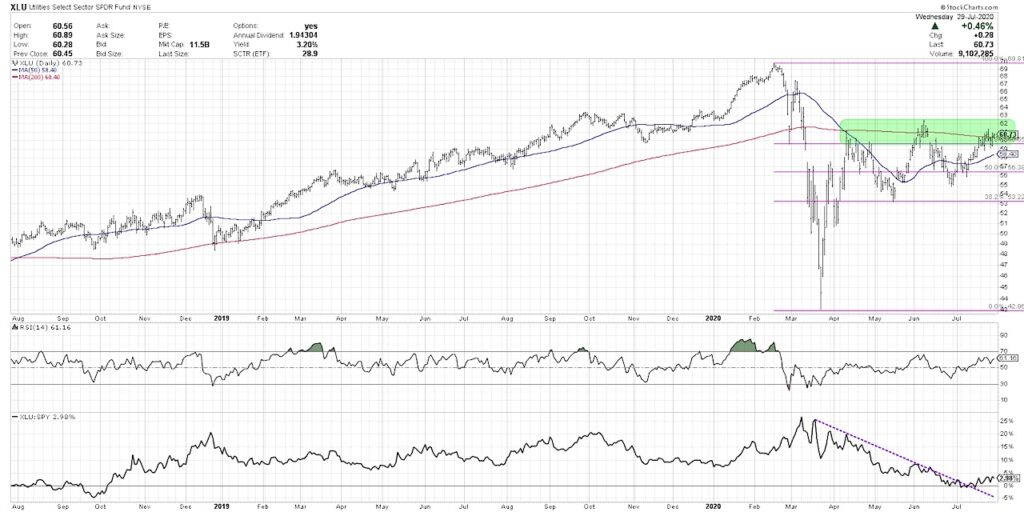
Starting at the top of the chart we have the daily prices going back two years, and here we can really focus on the February to March selloff. The XLU topped out right around $70/share and by March 23rd, when all was said and done, it hit a low right at $43/share.
From there it quickly retraced 61.8% (a key Fibonacci retracement level) which was also right around the 200-day moving average. This resistance range around $60-61 lined up with the close in late February after the first big gap down off the February highs. All of this confirmed the $61 level as a key resistance point.
For the last three months the price has chopped around and essentially traded between these key Fibonacci levels, from support around $53 to resistance around $61. The XLU found support in mid-May right at the 38.2% level, then rose and attempted to eclipse the 200-day moving average but was repelled. Every time it tried to close above the 200-day moving average it reversed back below.
The question now is: will the Utilities Sector be able to remain above resistance and push through to higher highs? Step 1, can it close above the 200-day moving average (which it actually did again this week)? Step 2, will it be able to follow through with additional upside momentum?
When you have a breakout above a resistance level, it’s always important to see confirmation, or a follow-through day. What this means is you continue on and you have some sort of continued momentum. This suggests that buyers weren’t just pushing it to that level, buyers are willing to push the price above that resistance level.
We did not get follow-through in April when price failed at the 200-day. We did not get follow-through in early June when it broke above the 200-day then quickly reversed back down. Now for the third time we’re testing this price range. Until the XLU is able to eclipse $62.50, break above those June highs and show staying power above the 200-day moving average, I think you have to assume that it’s just a resistance range that will continue to repel the advance.
If and when the XLU breaks down back through that 200-day and breaks down through support at the 61.8% line (around $59.50), then that would suggest some further internal weakness.
Looking further down on the chart, the 2nd panel shows the RSI, and you’ll note that in April the RSI did not break above the 60 level. In June, it broke just above 60 and then again turned lower. This week, we’re right back again at that 60 level.
In a bull market, the whole range for the RSI tends to move higher. The RSI tends to become overbought on upswings, and on downswings will only get back down to around 40. We saw that in mid-2019 a number of times.
In a downtrend, in more of a bearish phase, the RSI will become oversold and won’t often get above 60 (sort of the upper boundary of the RSI). Keep in mind the overall range for the RSI will often tell you about the overall underlying characteristics of the trend.
This week, the price has pushed the RSI to the upper limits of that bearish range. The RSI is right about at 60, which is sort of the line in the sand differentiating a bear market rally from a trend with greater upside potential. A price breakout, confirmed with increasing momentum, would certainly validate potential for further upside.
Finally, we’re looking at the relative strength. You can see that Utilities have been underperforming the S&P 500 from mid-March through the first week in July. You’ll also notice that the downtrend line using the relative strength values was violated in that first to second week in July.
The change in relative strength over the last six months illustrates a distribution phase of a downtrend, a consolidation phase of a sideways move, and now arguably we’re starting to turn higher into a sort of accumulation phase. I think a break above price resistance with improving RSI and improving relative strength would certainly suggest a high percentage probability of further upside in Utilities, even getting back to those February highs around $70.
The other key to this Utilities thesis is the dividend yield. The XLU has a yield of about 3.2%, while the S&P 500 is about 1.8% so it’s almost double the dividend yield that you would get on the S&P. Many Utilities names have a higher yield that would provide a greater income potential when you think of long-term return components of capital appreciation and dividend yield.
The XLU, the Utilities sector, is my One Chart for today because it’s at a key resistance range. If it’s able to eclipse $62.50 and that coincides with improving momentum, and also with continued improvement in relative strength, I think a traditional defensive sector like Utilities may present a solid opportunity going into the fall.
To watch this in video format, just head over to my YouTube channel!
Twitter: @DKellerCMT
The author does not have a position in mentioned securities at the time of publication. Any opinions expressed herein are solely those of the author, and do not in any way represent the views or opinions of any other person or entity.


