 By Brad Tompkins
One of the difficulties using traditional Technical Analysis [TA] to make trading decisions is that there are times of imprecise signals. In those instances it is important to realize that TA is as much an art as it is a science. And it requires some advanced technical skills.
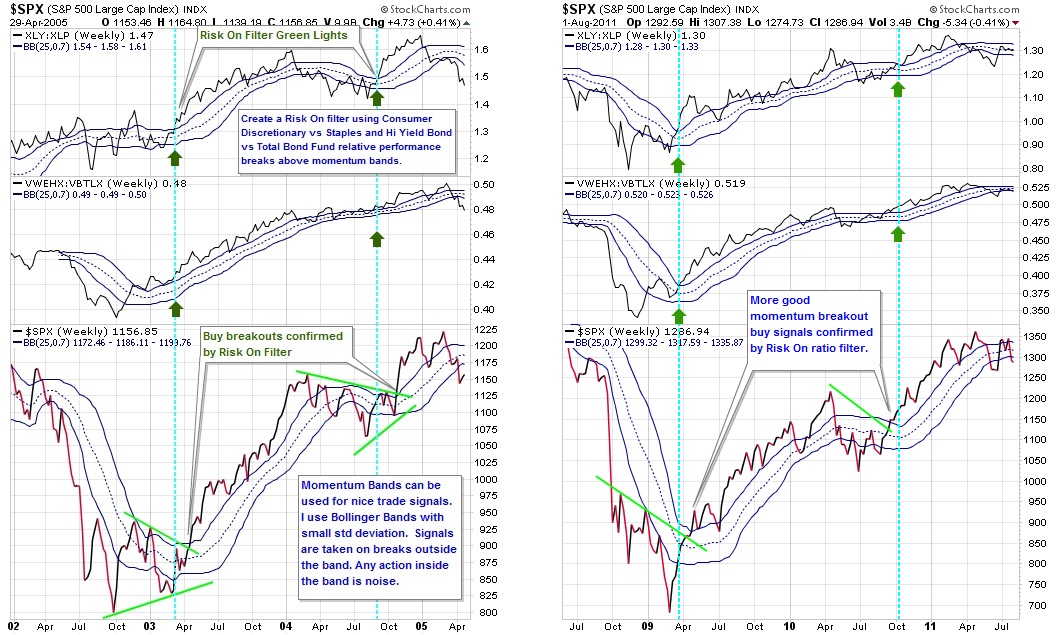
To illustrate, here are a series of charts that demonstrate a fairly reliable long term position entry signal using tight Bollinger Bands as a momentum indicator. We can further improve the signaling by adding a Risk On filter which should accompany S&P 500 (SPX) price breakouts. The idea behind the Risk On filter stems from a history of watching money rotate into or out of risk assets (high yield bonds, consumer discretionary stocks) at trend inflection points. The risk assets then display either relative out performance or under performance when viewed in ratios.
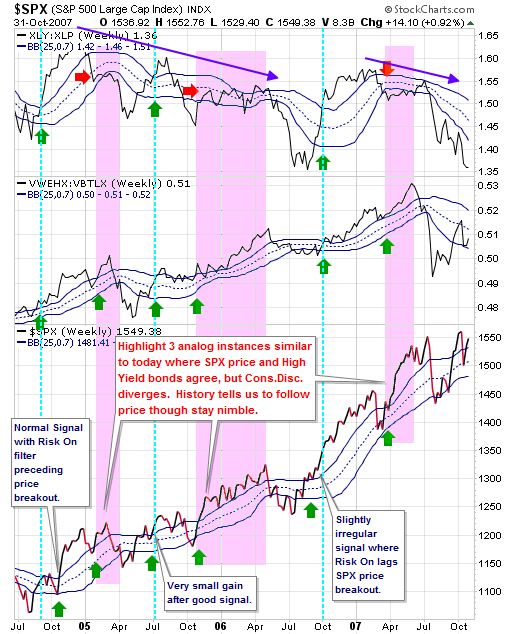
The first set of charts shows clear price momentum signals with risk filter green lights. The second set shows SPX price breakouts with risk filter red lights which accurately foretold sharp corrections. We also see the current setup – SPX price along with High Yield Bond breakout but no confirmation from the Consumer Discretionary sector. What to do? Look at the last chart which highlights three similar setups between 2005 – 2007. Those analog instances tell us that decent gains can follow in spite of the disagreement in Cons.Disc stocks. So stay long here until either SPX or High Yield bonds lose momentum.
The moral of the story is that traditional Technical Analysis can be a fantastic trading tool to put odds of success on your side, but there will be times of foggy signals. Have a plan to handle those as well.
Chart 1:
Chart 2:
Chart 3:
———————————————————
Twitter: @BBTompkins and @seeitmarket Facebook: See It Market
Position in S&P 500 Index SPY at the time of publication.
Any opinions expressed herein are solely those of the author, and do not in any way represent the views or opinions of any other person or entity.


