Recently, I started using Market Profile in my day trading analysis. It serves to provide a useful adjunct to trend analysis and the probability of market direction. While I think a basic understanding of Market Profile is helpful, teaching the fundamentals of Market Profile is not the point of this article. I simply want to work it in to our analysis and use it to complement current tools that help to keep us in the trend.
Utilizing Market Profile may be most useful in recognizing where the value area may lie on any given trading day. What stands out for me at the end of any session is not what occurred during it, but what still remains open at the end. To what “open” do I speak of?
Open Daily Gaps and Open Points of Control for regular trading hours (RTH).
A daily gap identifying the settlement close of the previous day. On many days, price action will tend to close the daily gap and then proceed in any given direction. There are also those days that the daily gap never gets closed and price runs in the opposite direction. By simply looking at any daily chart of RTH, you will notice that all open daily gaps eventually get closed.
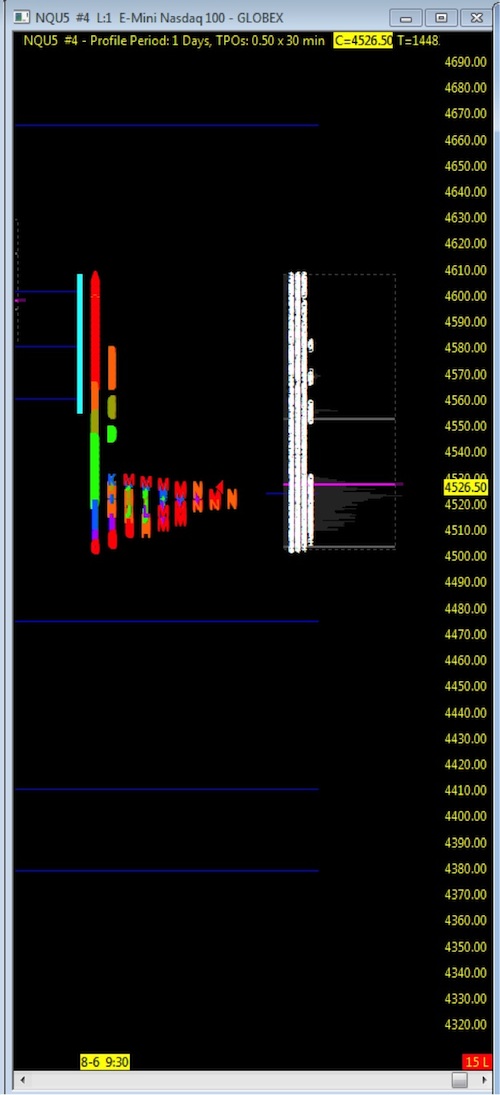
A similar setup that occurs on a daily profile is the open point of control. Each day, as price action closes out on the Market Profile, it leaves a distinguished line; the point of control. If price action continues the next day in the opposite direction, like the open daily gap, it leaves us with an open point of control. Similar rules apply; by simply looking at any daily chart of RTH of the market profile, you will notice that ALL open points of control eventually get closed.
To explain this visually, let’s use the Nasdaq (NQ) futures. Seen here, since 6.29.15, while price action moved away from several open points of control, it eventually closed it out. Whether it took 1 or 6 days, price found its way to finish up business below or above.
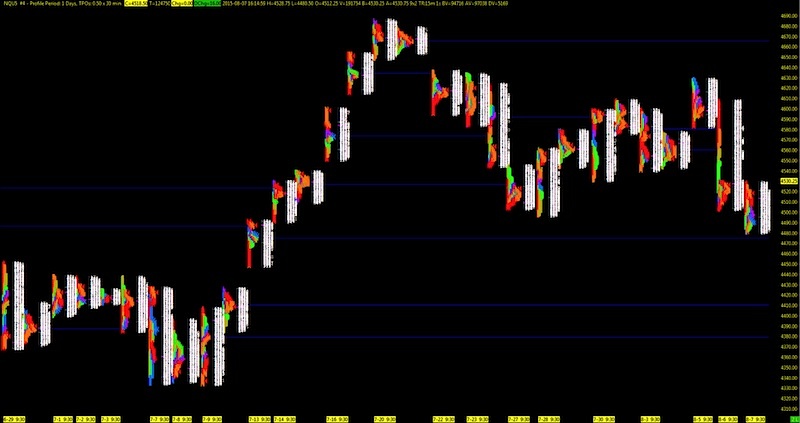
Again, let’s look at the chart below as an example of open points of control that were never closed (represented by one blue line above and three below). This doesn’t necessarily mean that the price action will close it out on any particular day, it simply identifies one level above and three levels below that eventually, will get closed.
So how does this information assist me as an intraday trader? Knowing that it eventually will get closed, price can turn upside and close out the line above before turning downside. Better yet, how does it help determine the current TREND of the market to see if the point of control will get closed? Would it be that easy to short the market knowing I have three open points of control below?
By itself, the market profile is not enough.
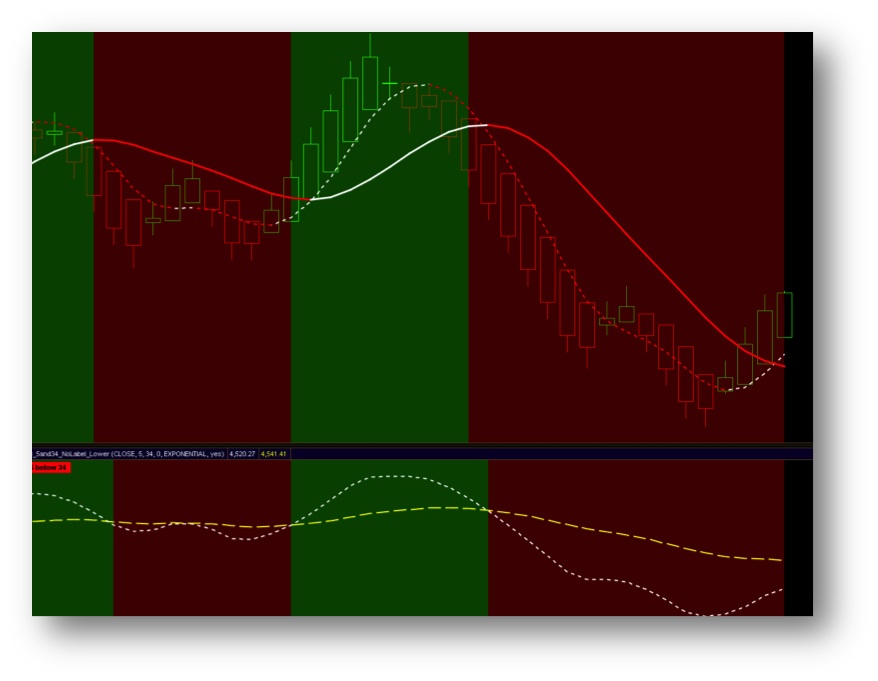
This is where I add in my TREND strategy that utilizes moving average crossovers. As seen in the chart below, the two upper T3 moving averages on a 50 tick range chart crossed awhile back including a 5/34 moving average crossover study below. The combination of these two moving average studies clearly identifies a downtrend in the market that has been closing out the open points of control as seen in the charts above. Identifying this on the bigger picture, allows traders to remain in the TREND for that much longer. They also know that there are open points of control that have yet to be closed.
While price action has turned slightly upside at this time, the probability of the downside move will be greater once the moving averages are in unison in TREND.
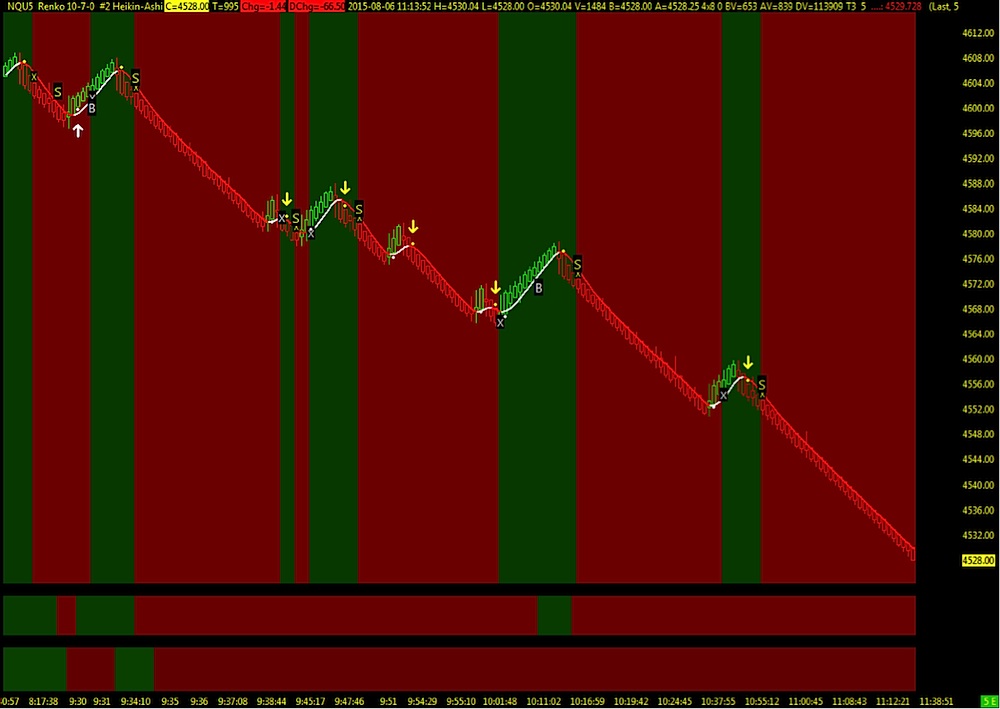
When asked what direction I believe the market is headed, truth be told, I have no clue. When I see a trend on any given day, both directions work for me without bias. However, I take note, that with a moving average crossover that has been a clear setup to the downside on the bigger picture; the intraday setup is that much more likely and probable of leading in the direction of “unfinished business” – closing out points of control (chart below of downside trend on 8.6.15). With the larger time frame confirmation of TREND direction, the smaller intraday frame adds the additional confirmation of TREND towards the open point of control.
A Simple Strategy
Identify your open daily gaps and points of control. Know that eventually ALL open gaps/points of control will be closed. Intraday trades that are setup in the direction of the TREND of the open level have a decent but never 100% probability of closing out. Know that if price does close it, price may tend to fade/bounce off of it.
If you are interested in learning more about Market Profile, I recommend reading the CME document and two additional books on the topic by Steidlmayer and James Dalton.
As for where the market is headed on the NQ futures – let’s finish business below and go close out the open points of control. Till then, I’m always ready in both directions.
Twitter: @TradingFibz
The author does not have a position in any of the mentioned securities at the time of publication. Any opinions expressed herein are solely those of the author, and do not in any way represent the views or opinions of any other person or entity.


