All the major U.S. stock market indices are at important levels right now. From the Dow Jones Industrial Average to the NASDAQ to the S&P 500 to the Russell 2000, the setups may vary, but the price levels are important.
In the following 4 charts of the major stock market indices, you’ll see long term trend lines that have either been cleared or price is nearing now.
Here’s a high level overview of what the charts are saying and what levels investors should be watching:
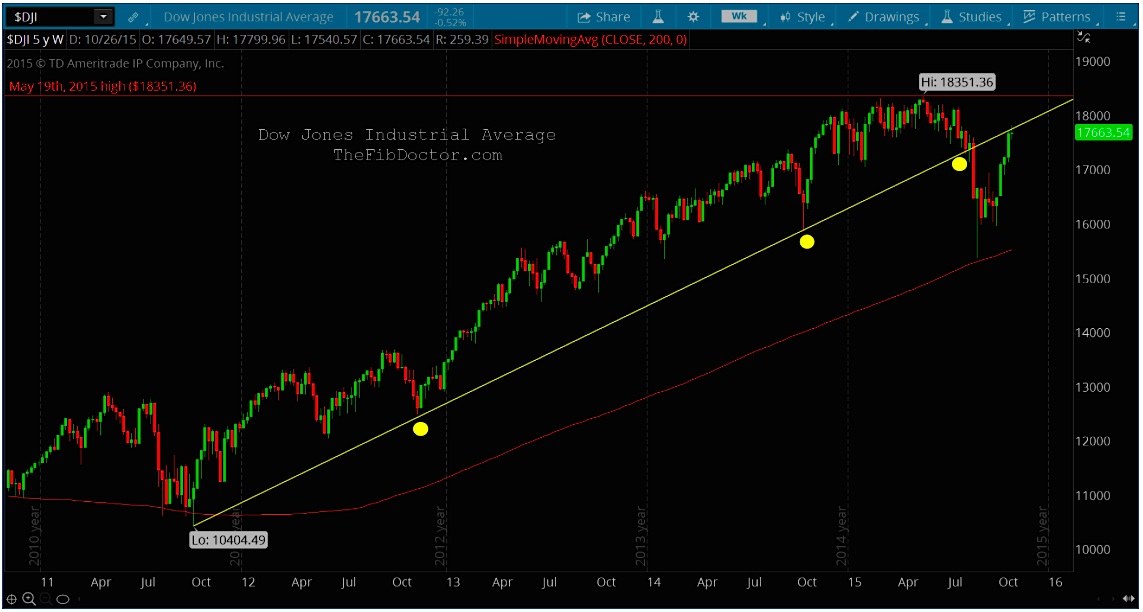
- The Dow Jones Industrial Average is pushing against it now.
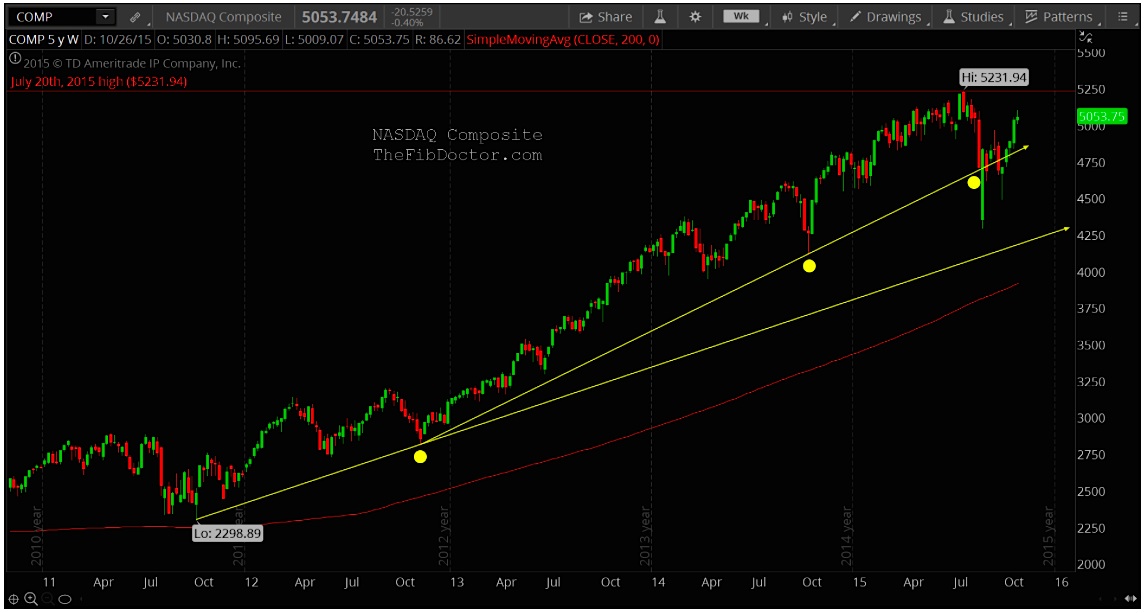
- The NASDAQ Composite has cleared and held above the trend line for 1 month now.
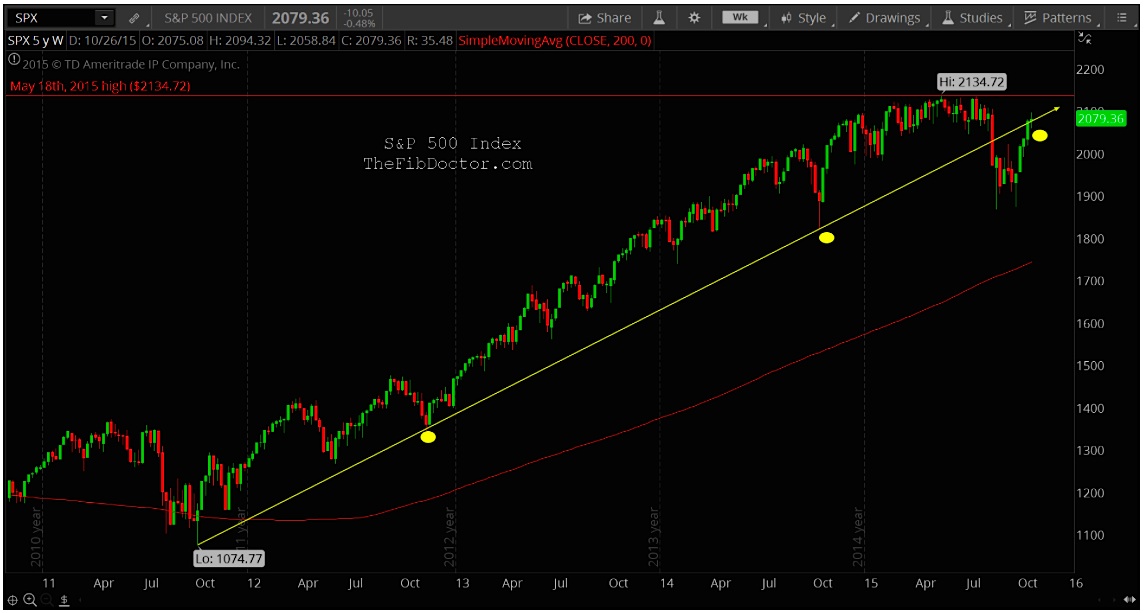
- The S&P 500 is currently sitting on the trend line.
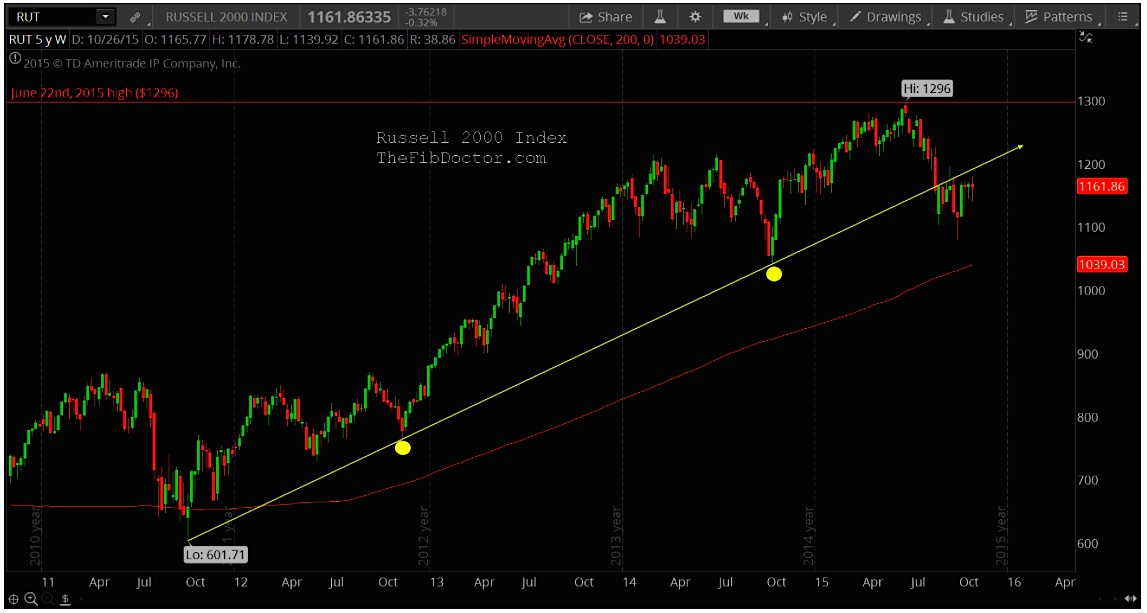
- The Russell 2000 is approximately 30 points under the trend line.
Above the trend lines for these U.S. stock market indices are highs that will need to be broken to keep this bull market intact.
Dow Jones Industrial Average – 5 Year Weekly Chart
NASDAQ Composite – 5 Year Weekly Chart
Standard & Poor’s 500 Index – 5 Year Weekly Chart
Russell 2000 Index – 5 Year Weekly Chart
Watch these levels closely; they will yield clues as to whether the bull market has more upside or is becoming exhausted.
Thanks for reading and always use a stop.
Twitter: @TheFibDoctor
No position in any of the mentioned securities at the time of publication. Any opinions expressed herein are solely those of the author, and do not in any way represent the views or opinions of any other person or entity.


