The major stock market indexes have been trying to get traction with the rally off the early August lows.
But they may be just a “bounce”.
It doesn’t take much to understand that, although the week long bounce has “felt good”, it has yet to make significant progress in shaping lasting low.
One technical indicator that is a a quality gauge for any rally attempt of a low is the 50 day moving average. In this case the charts below can speak for themselves. The S&P 500 Index INDEXSP: .INX, Nasdaq Composite INDEXNASDAQ: .IXIC, Dow Jones Industrial Average INDEXDJX: .DJI, and Russell 2000 INDEXRUSSELL: RUT all have yet to rally past their respective 50 day moving average. The market could be biding its time for another selloff.
Note that the following MarketSmith charts are built with Investors Business Daily’s product suite.
I am an Investors Business Daily (IBD) partner and promote the use of their products. The entire platform offers a good mix of technical and fundamental data and education.
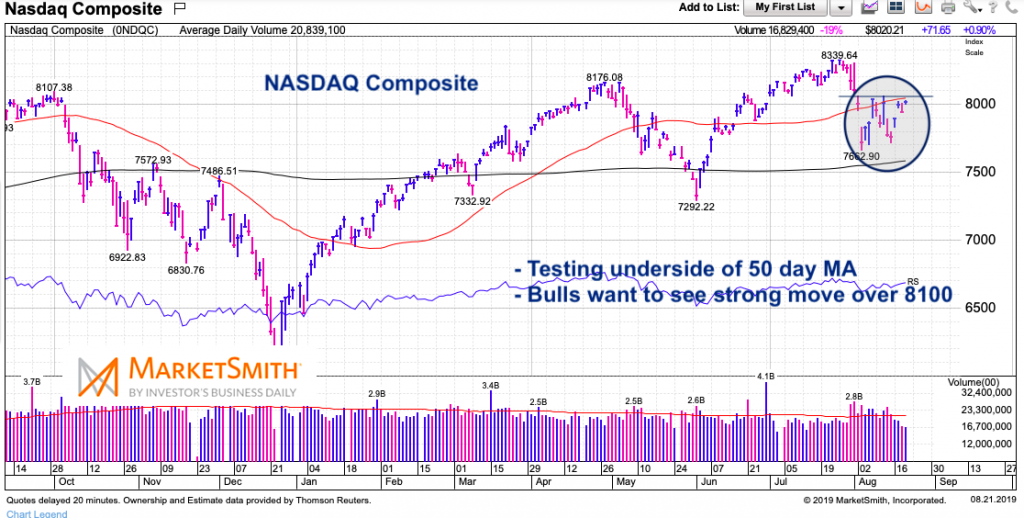
NASDAQ Composite “daily” Chart
Tech stocks have been leader of this long term bull market. Bulls would love to see the Nasdaq clear its 50 day moving average. If not, look for another selloff.
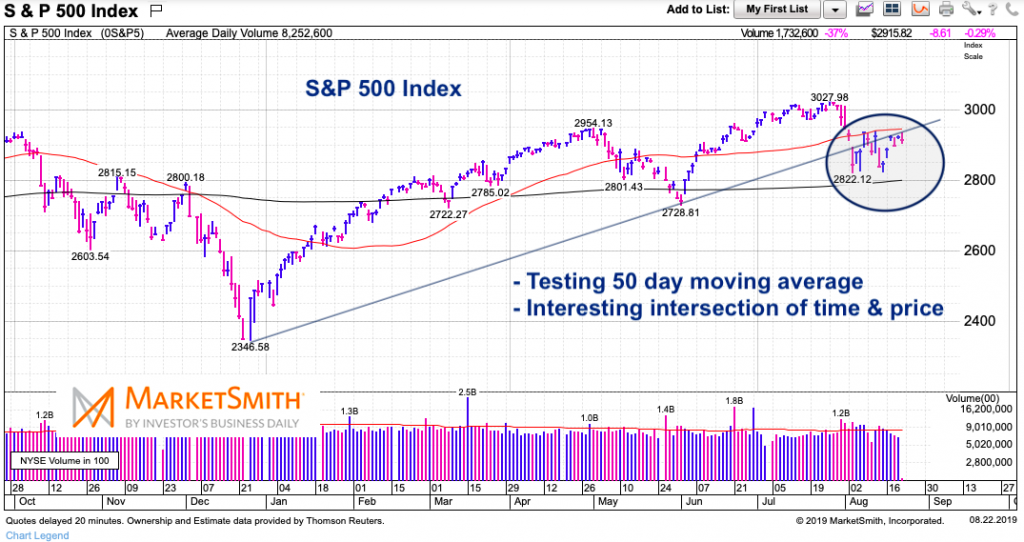
S&P 500 Index “daily” Chart
Same thing with the S&P 500. Notice the interesting intersection of time and price here – key resistance.
Twitter: @andrewnyquist
The author may have a position in mentioned securities at the time of publication. Any opinions expressed herein are solely those of the author, and do not in any way represent the views or opinions of any other person or entity.


